Start Here: Building the Tool While Using It
An entry map for the project that frames the live build log. It starts with the genesis series, then moves forward through the next posts in order.

Writing into being.
An entry map for the project that frames the live build log. It starts with the genesis series, then moves forward through the next posts in order.
Documents the prose-lint script and its role in catching AI writing habits. Explains the scoring system, the rules it enforces, and how threshold-based gates prevent formulaic prose from entering published content.
Explains why I build this in public and how writing reshapes the technical decisions. It also sets out how I keep pace without losing voice, using the prose-lint tool to catch drift.
Defines the article as a single file in a dated folder so the URL stays stable. It links that structure to reader trust in old links and a durable archive.
Explains why the body stays plain Markdown and readable on its own. It commits to a reader surface that survives even if the build disappears.
Defends a declarative selection model where queries choose and templates stamp. It keeps lists debuggable and prevents hidden selection rules.
Sets out why the repository holds both the writing and the build so decisions stay traceable. It anchors that structure in classic web values and a minimal toolchain.
Shows how templates solve duplication and keep structure consistent across pages. It sets up the stamp model as the reason this series exists.
Presents the stamp model where queries select and templates place prepared content, with a concrete example. It aims for templates that read like documents and still produce reliable pages.
Frames self-publishing as a technical choice that keeps writing durable and under my control. It ties that choice to why I am building this system and publishing here.
Argues that owning the domain is the first unit of independence. It calls the reader to secure the address before building the site.
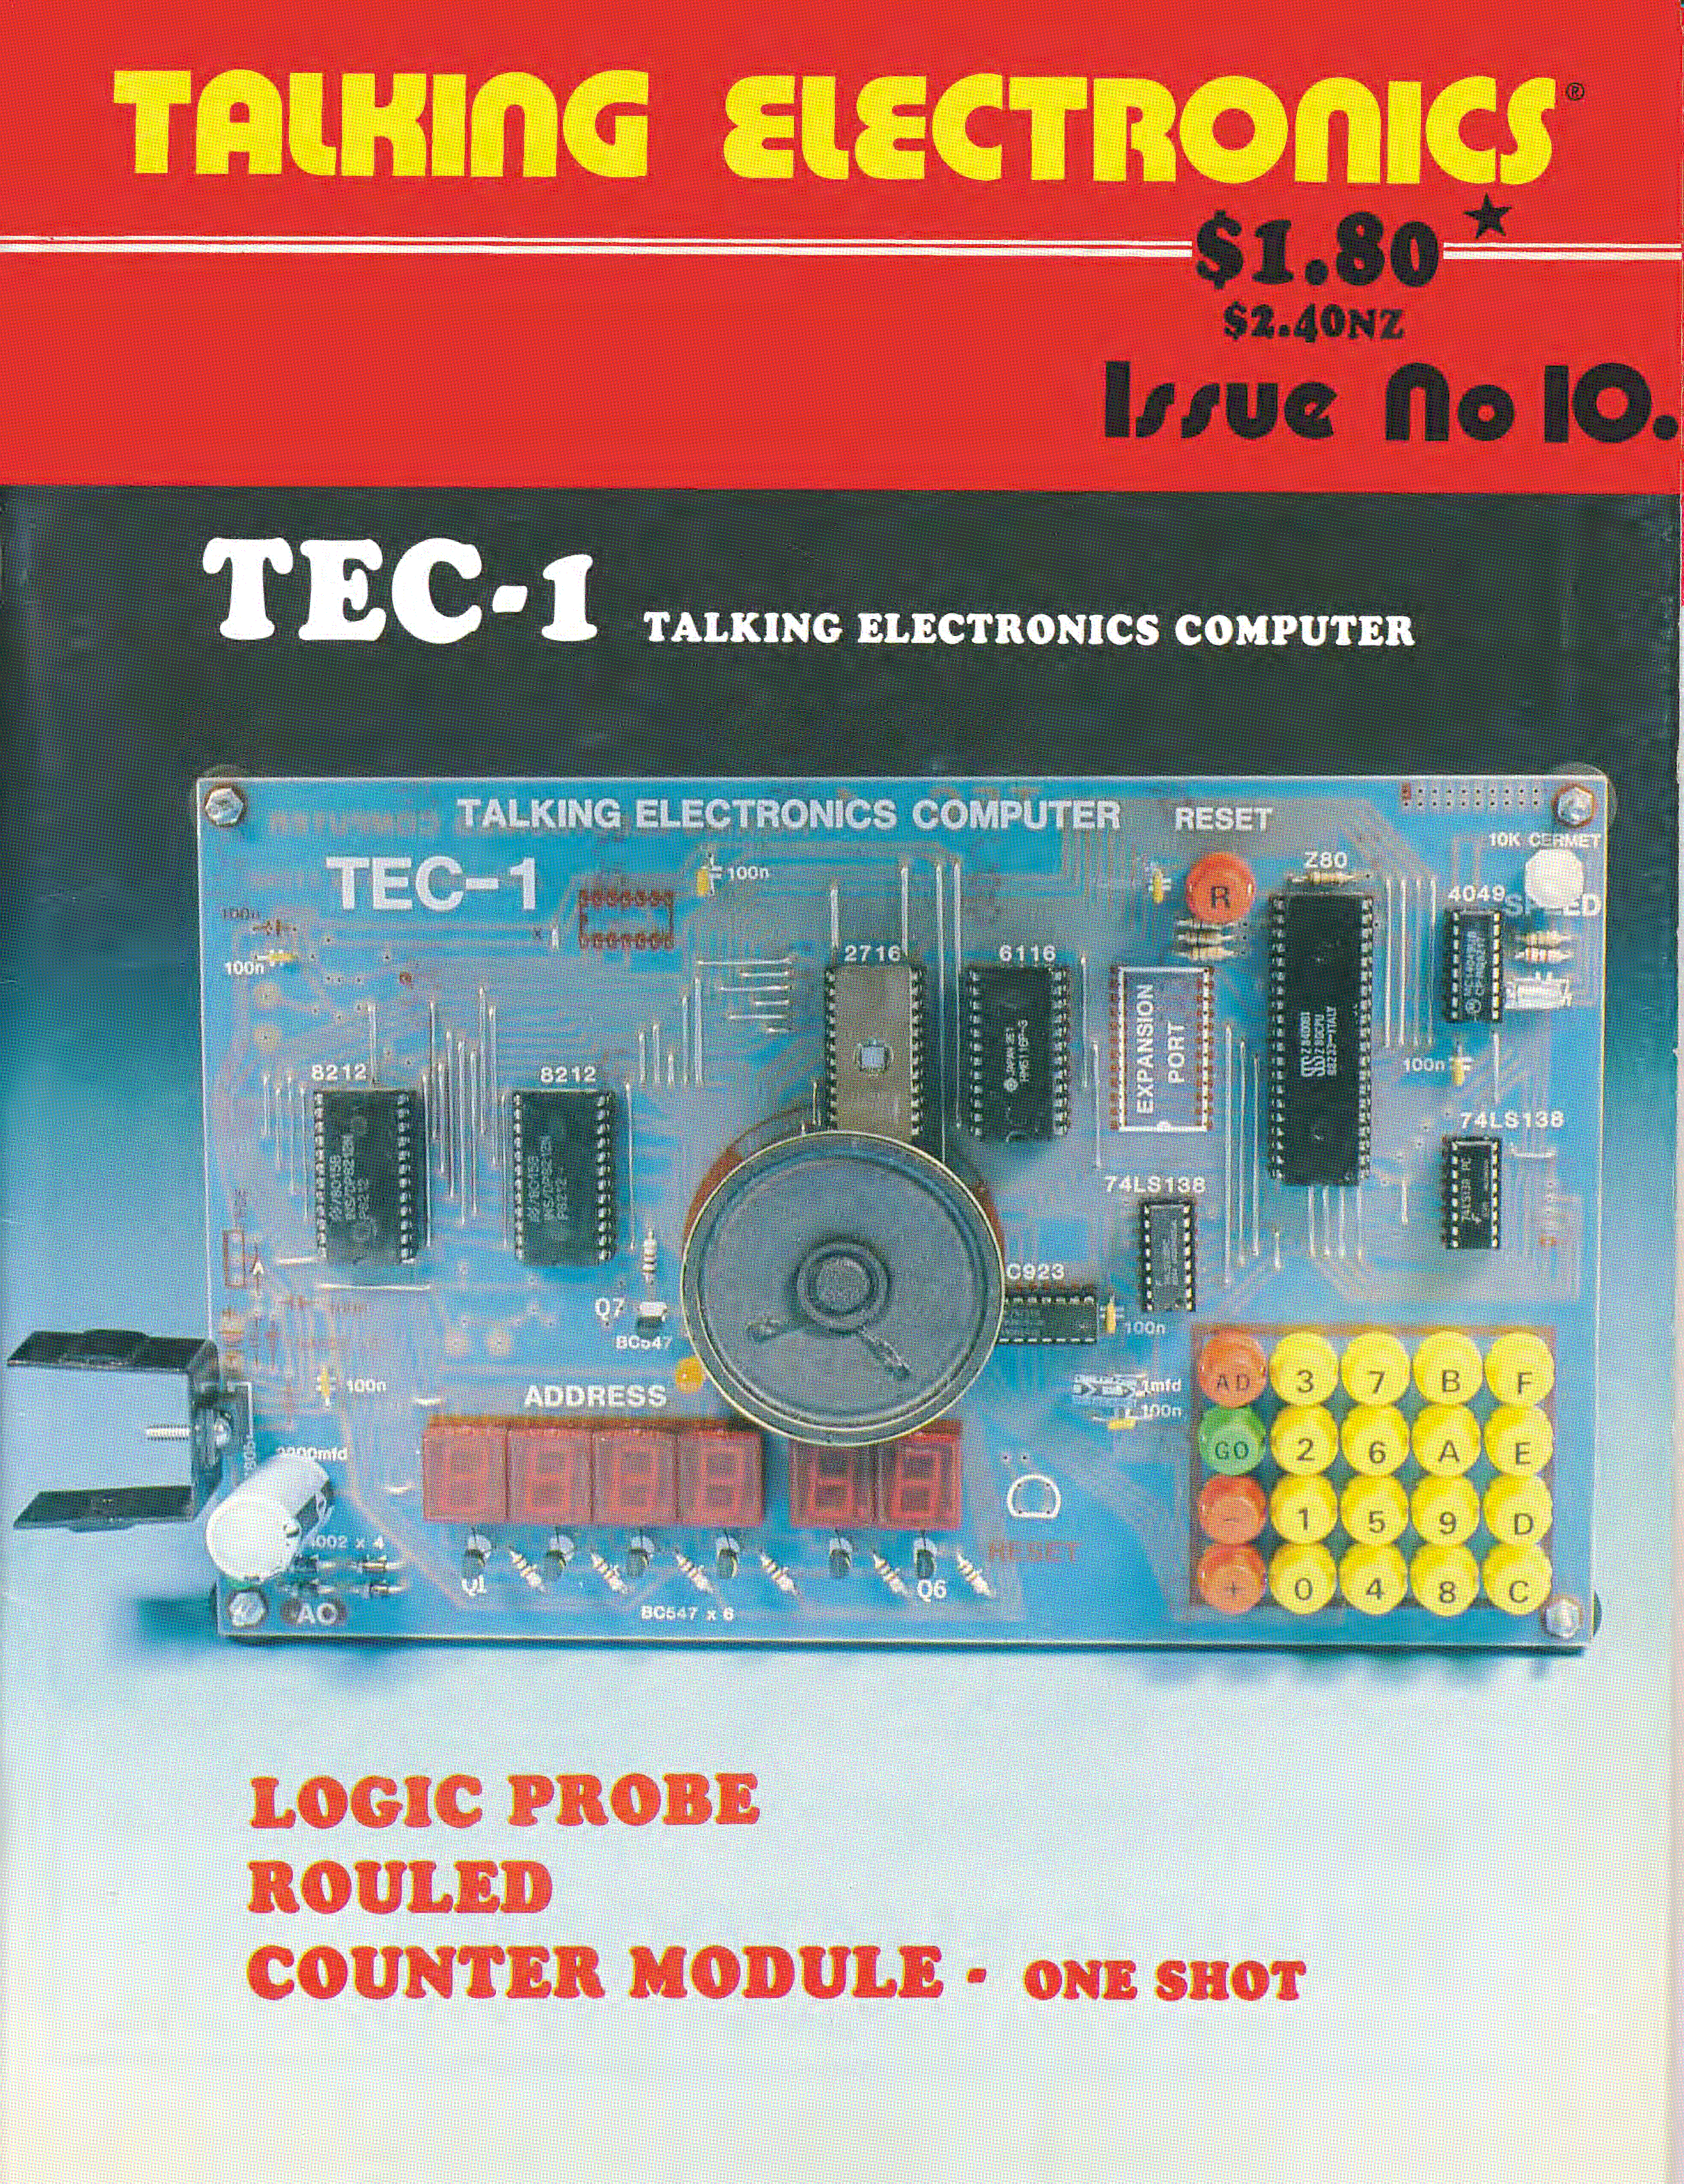
My work with the Z80 began on paper in the late 1970s and became real hardware in the early 1980s. This series documents a return to that architecture through the construction of a modern debugging environment.

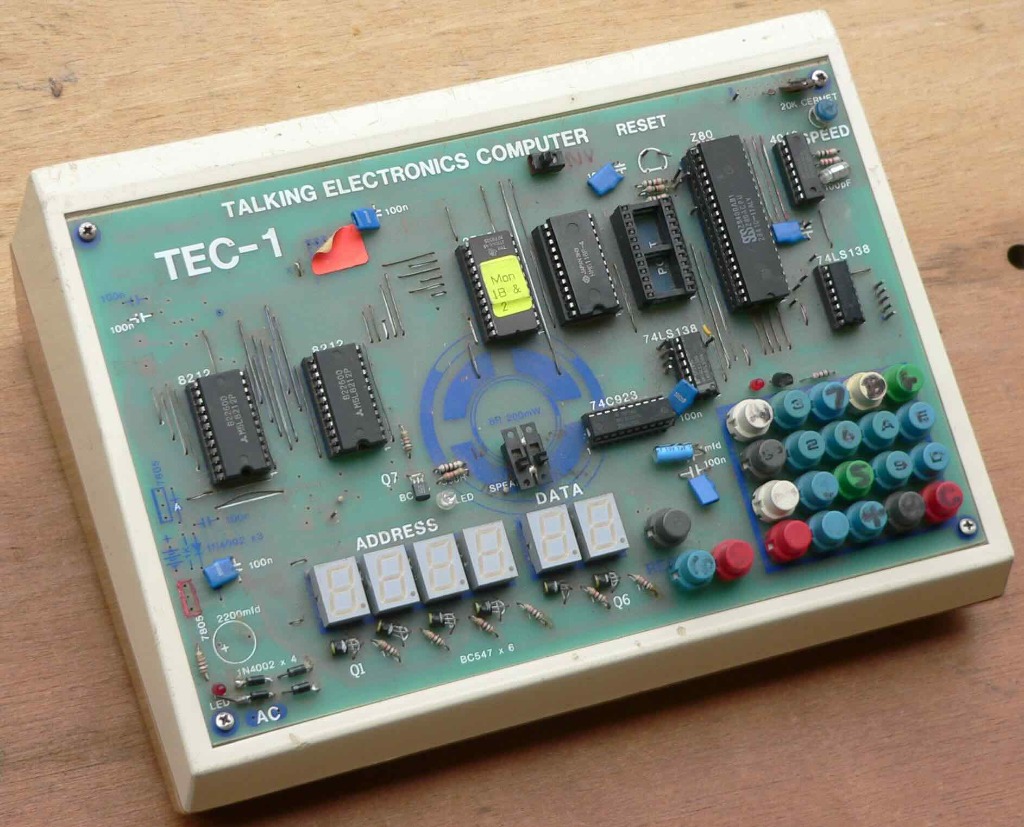
The TEC-1 defines a small but complete hardware platform. Its memory map, I/O model, and human interface provide a concrete starting point for Debug80’s platform system.
Debug80 integrates a JavaScript Z80 assembler with VS Code’s debugging infrastructure to create a coherent environment for building and observing Z80 programs.
Debug80 treats assembler listings as primary data and uses them to build explicit mappings between source code and runtime execution.

Building a debugger means implementing the Debug Adapter Protocol. For Debug80, I chose an inline implementation to keep the connection between the interface and the machine model as tight as possible.
The first step in building Debug80 was establishing a stable bridge between the VS Code Debug Adapter Protocol and the Z80 execution environment. This article explores the initial DAP implementation and the integration of the asm80 assembler.
Debugging is the process of making the invisible visible. This article examines how Debug80 implements terminal interaction and rich register visibility to provide a legible state of the Z80 machine.
Writing a small assembly routine is manageable. Writing a 2,000-line textual adventure game is a different challenge entirely. This article explores how I organised the Caverns 80 project using modular architecture and declarative rule engines.
Source-level debugging in VS Code requires a precise mapping between machine addresses and source lines. This article details how I developed the D8 Mapping Specification to bridge the gap between Z80 machine code and original assembly source.
True hardware emulation requires more than just instruction execution; it requires a deterministic model of time based on processor cycles. This article explores the CycleClock and the challenges of emulating the TEC-1 periphery.
Scaling a developer tool requires identifying the boundary between the 'core' and the 'periphery.' This final article in the series discusses the transition of Debug80 to a modular, decoupled ecosystem.
I built a TEC-1 memory panel so the debugger could show live memory state without guesswork. This entry explains the snapshot request and the windowing rules, then shows how the panel grew into a multi-view dashboard with symbol context.
I removed the TEC-1 program loader from the core debug80 extension and moved machine content into its own repo. This entry explains why the split mattered and how the platform pack is laid out. It also shows what makes the setup runnable on day one.
The TEC-1G is not just an upgraded TEC-1. It has a different memory map along with a richer monitor ROM along with hardware features that require their own emulation logic. I added a dedicated platform target to Debug80 so the debugger handles these differences correctly from the start.
When debugging user programs on the TEC-1 I kept hitting a wall at ROM boundaries. The debugger could step through my code but the moment execution jumped into the monitor ROM the source view went dark. I fixed that by teaching Debug80 to load external listings then build source maps from assembly files at session start.
Debug80 regenerated its debug maps on every session start even when the underlying source had not changed. I added content-hash based caching to skip redundant work then tackled two quality-of-life improvements: auto-opening source files plus consolidating the memory panel.
The Debug80 panel started as a full-sized webview that competed for screen space with the editor. I migrated it to VS Code's sidebar using the WebviewView API which keeps the panel visible without stealing focus then allows per-session filtering through the activity bar.
The TEC-1G includes an HD44780-compatible LCD display. Debug80 needed to simulate it accurately. I finished implementing the remaining controller features: entry mode plus display control plus cursor behaviour plus shift behaviour plus custom character RAM.
The TEC-1G's I/O ports use full 8-bit address decoding while the original Debug80 simulation only checked the low three bits. I fixed the port decoding then added the expansion banking registers bringing the simulation closer to the real hardware behaviour.
When I looked at the webview code for Debug80, I found 2,866 lines of JavaScript embedded as template literals inside TypeScript files. I extracted them into proper TypeScript modules alongside HTML templates alongside CSS files. After adding esbuild bundling, the maintenance burden dropped considerably.
The Z80 instruction decoder for Debug80 grew to 1,616 lines of switch statements and lookup tables. I split it into prefix-based modules and added WeakMap caching so that each unique instruction decodes only once. The cache key is the instruction bytes themselves. The hit rate in typical programs exceeds 95 percent.
The ST7920 graphical LCD controller has a read pipeline that returns stale data on the first read after setting an address. I discovered this behaviour while debugging a display routine that worked on hardware but failed in emulation. Fixing the emulator required understanding how the real chip sequences its internal operations.
ZAX is a structured assembler for the Z80 family that keeps registers, flags, and memory placement explicit while giving larger programs modules, typed layouts, real function calls, and readable control flow.
ZAX uses typed inline op declarations instead of text macros so reusable instruction patterns stay readable, predictable, and grounded in real operand shapes.
ZAX gives larger Z80 programs a stronger shape through modules, named sections, typed layouts, stable call boundaries, and structured control flow that still follows the machine.
On the January 2025 Copyright Office advice that vibe-coded software is public domain, why chat-window prompting fails to transfer authorial intent, and what a clay-like programming interface would need to do differently.

This article examines the legal parallel between the monkey selfie case and software generated by large language models. It considers what happens to ownership, licensing, and open source when code lacks traditional human authorship.
This article argues that code generated without sufficient human authorship may fall into the public domain by default. It frames that legal risk as a neglected issue inside the current rush toward AI-assisted software development.
A video version of the argument that AI-generated code may lack the human authorship needed for copyright.