How ZAX Makes Larger Z80 Programs Manageable
ZAX gives larger Z80 programs a stronger shape through modules, named sections, typed layouts, stable call boundaries, and structured control flow that still follows the machine.

Writing into being.
ZAX gives larger Z80 programs a stronger shape through modules, named sections, typed layouts, stable call boundaries, and structured control flow that still follows the machine.
ZAX uses typed inline op declarations instead of text macros so reusable instruction patterns stay readable, predictable, and grounded in real operand shapes.
ZAX is a structured assembler for the Z80 family that keeps registers, flags, and memory placement explicit while giving larger programs modules, typed layouts, real function calls, and readable control flow.
The Z80 instruction decoder for Debug80 grew to 1,616 lines of switch statements and lookup tables. I split it into prefix-based modules and added WeakMap caching so that each unique instruction decodes only once. The cache key is the instruction bytes themselves. The hit rate in typical programs exceeds 95 percent.
The TEC-1G's I/O ports use full 8-bit address decoding while the original Debug80 simulation only checked the low three bits. I fixed the port decoding then added the expansion banking registers bringing the simulation closer to the real hardware behaviour.
When debugging user programs on the TEC-1 I kept hitting a wall at ROM boundaries. The debugger could step through my code but the moment execution jumped into the monitor ROM the source view went dark. I fixed that by teaching Debug80 to load external listings then build source maps from assembly files at session start.
The TEC-1G is not just an upgraded TEC-1. It has a different memory map along with a richer monitor ROM along with hardware features that require their own emulation logic. I added a dedicated platform target to Debug80 so the debugger handles these differences correctly from the start.
Scaling a developer tool requires identifying the boundary between the 'core' and the 'periphery.' This final article in the series discusses the transition of Debug80 to a modular, decoupled ecosystem.
True hardware emulation requires more than just instruction execution; it requires a deterministic model of time based on processor cycles. This article explores the CycleClock and the challenges of emulating the TEC-1 periphery.
Source-level debugging in VS Code requires a precise mapping between machine addresses and source lines. This article details how I developed the D8 Mapping Specification to bridge the gap between Z80 machine code and original assembly source.
Writing a small assembly routine is manageable. Writing a 2,000-line textual adventure game is a different challenge entirely. This article explores how I organised the Caverns 80 project using modular architecture and declarative rule engines.
Debugging is the process of making the invisible visible. This article examines how Debug80 implements terminal interaction and rich register visibility to provide a legible state of the Z80 machine.
The first step in building Debug80 was establishing a stable bridge between the VS Code Debug Adapter Protocol and the Z80 execution environment. This article explores the initial DAP implementation and the integration of the asm80 assembler.
Debug80 treats assembler listings as primary data and uses them to build explicit mappings between source code and runtime execution.

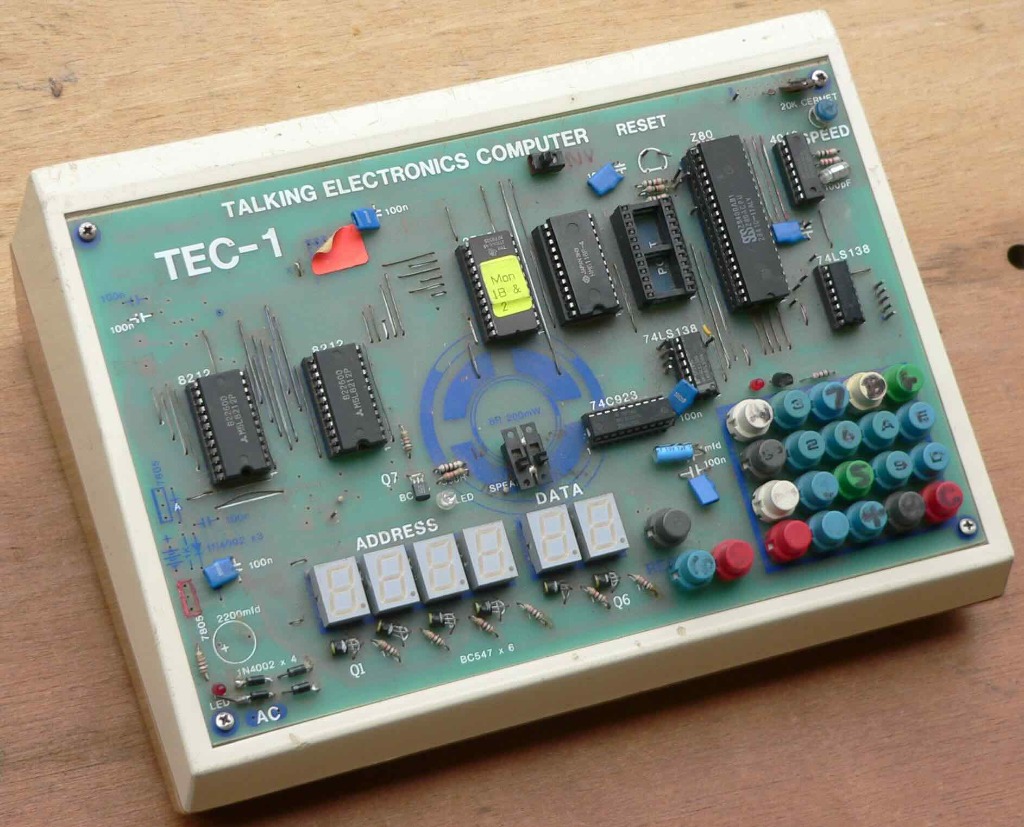
The TEC-1 defines a small but complete hardware platform. Its memory map, I/O model, and human interface provide a concrete starting point for Debug80’s platform system.
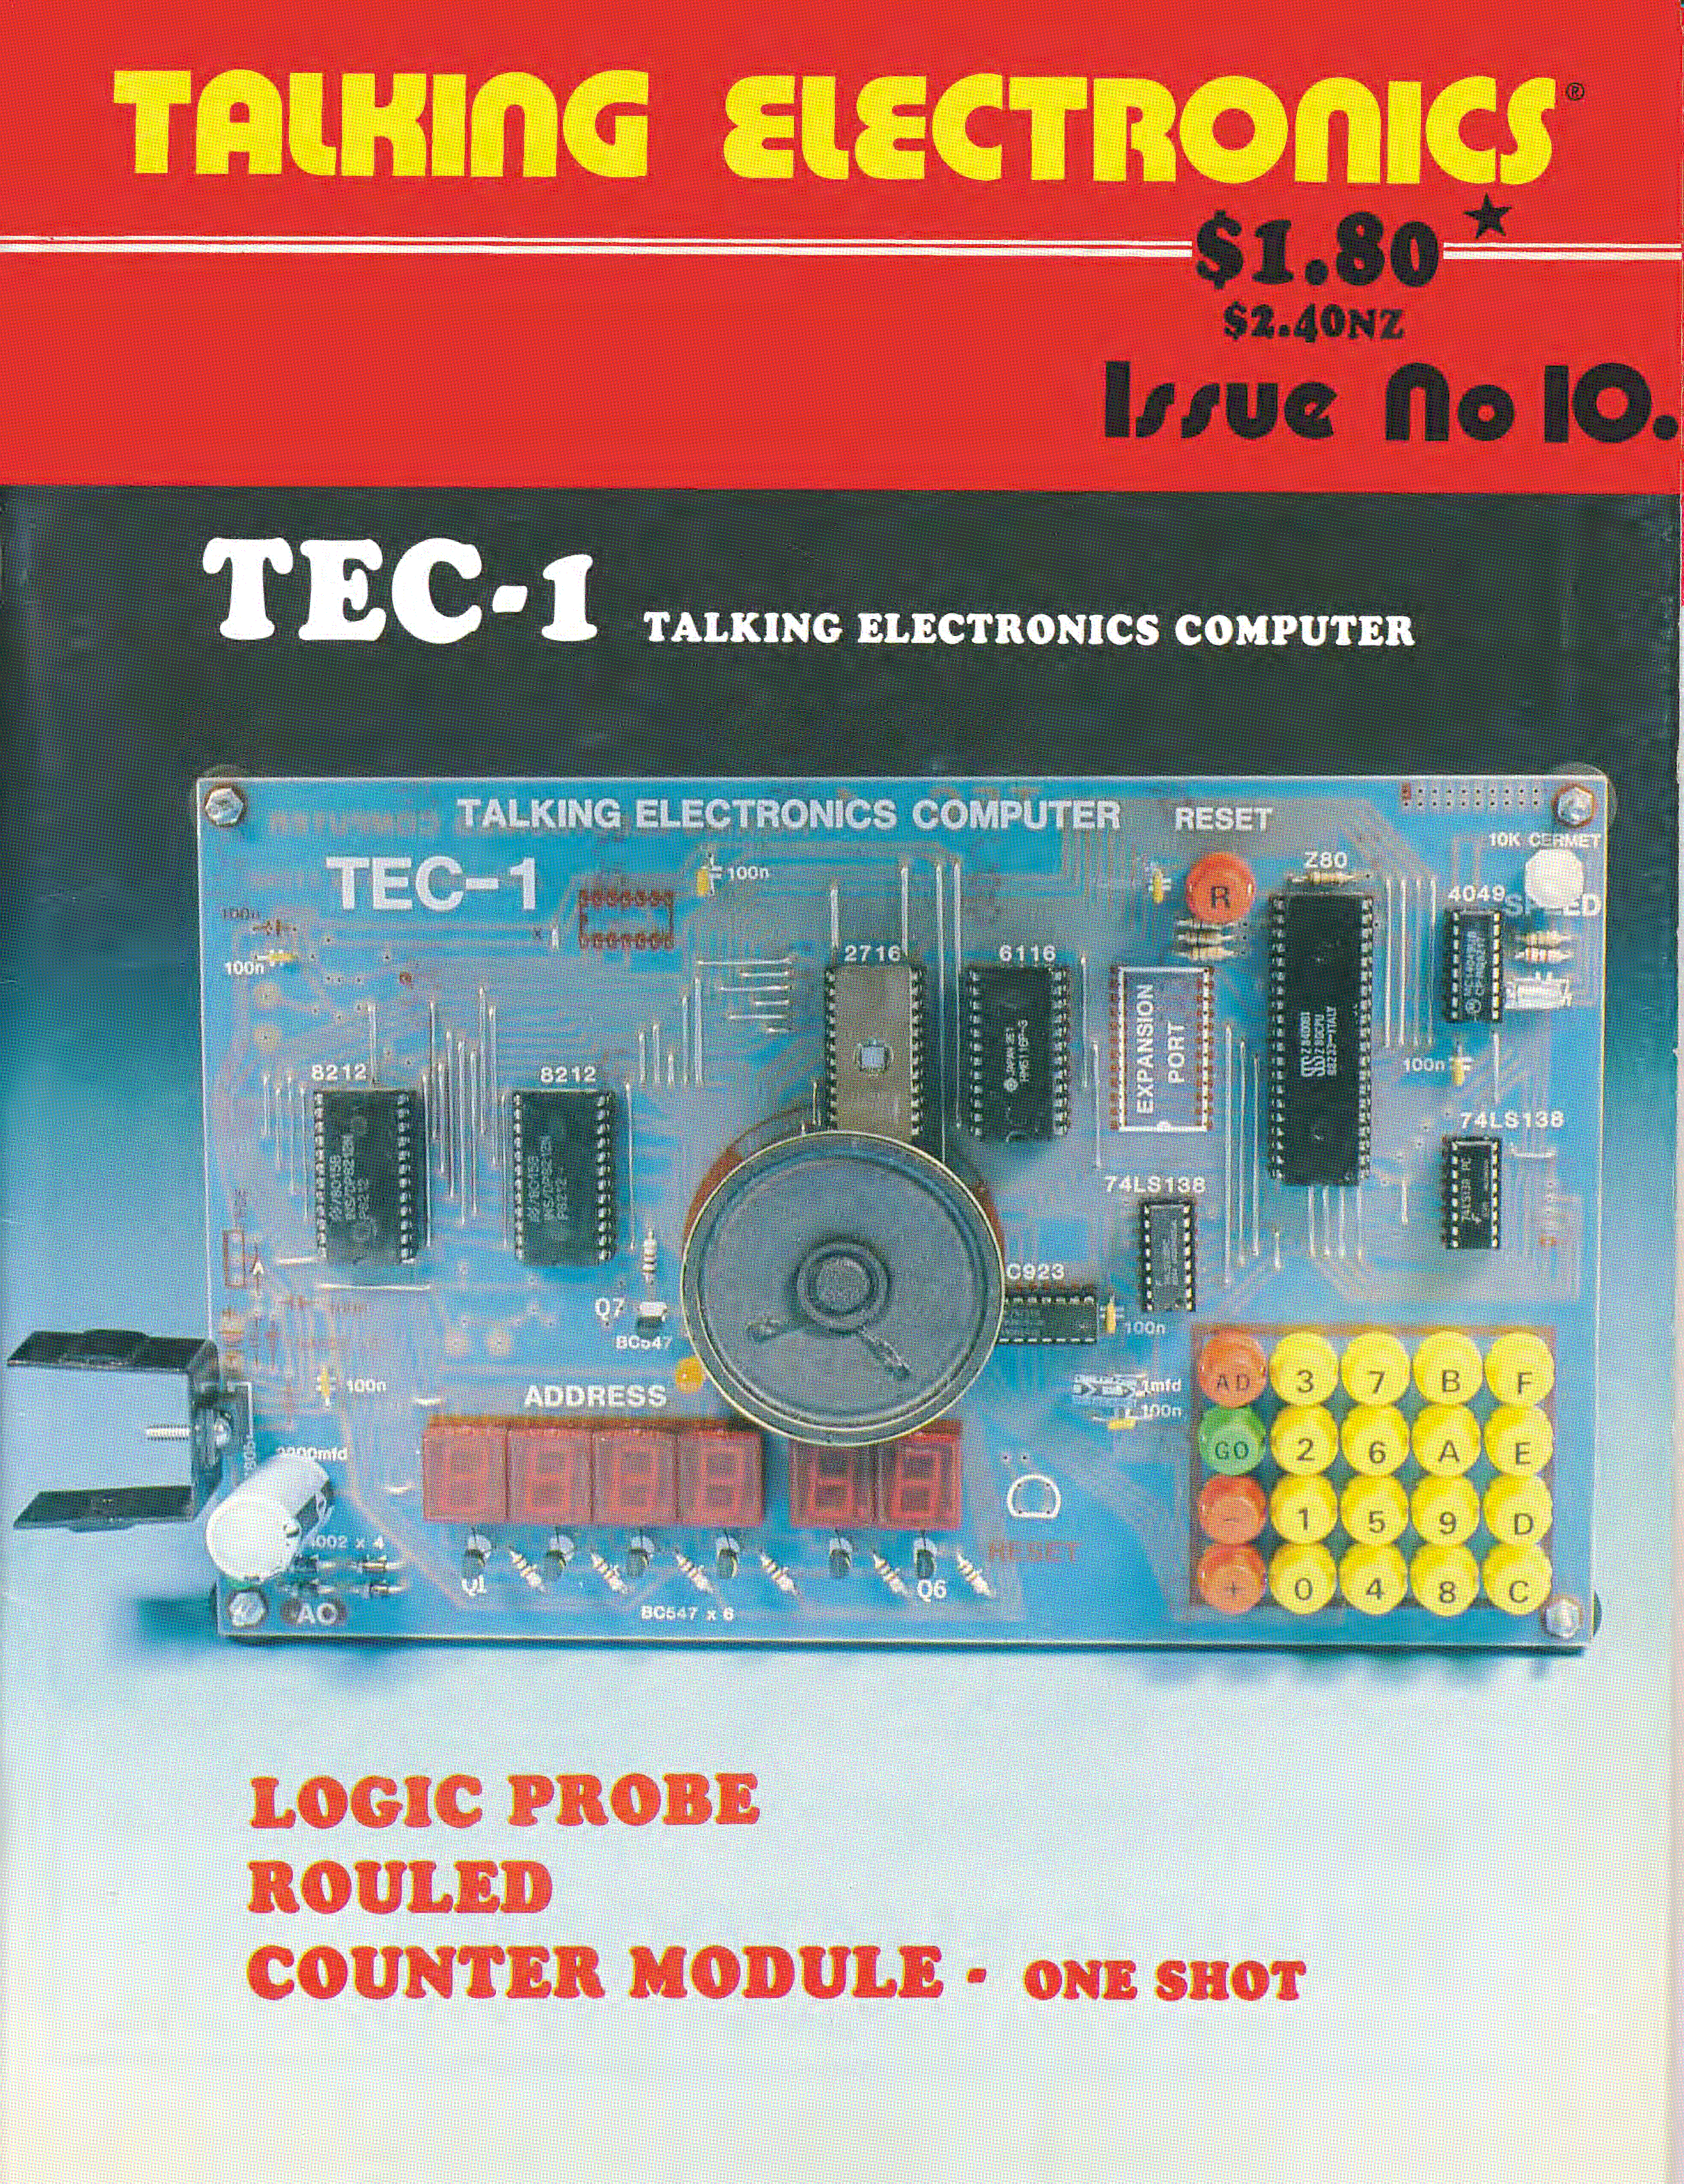
My work with the Z80 began on paper in the late 1970s and became real hardware in the early 1980s. This series documents a return to that architecture through the construction of a modern debugging environment.