In Debug80, the term platform carries a specific structural meaning. A platform acts as a machine description that models the memory and I/O devices alongside specific hardware behaviour. This model defines exactly how software runs on a particular system. Because the debugger remains largely platform-agnostic, adding support for a new machine simply requires a corresponding platform module. The TEC-1 serves as the first full implementation in this system because its small, bounded nature makes it a perfect starting point for development.
The TEC-1 blue prototype: a bridge between 1983 and the modern debugger.
A bounded machine
The original TEC-1 hardware utilizes a fixed and minimal memory layout. The ROM resides at 0000–07FF hex, while the RAM occupies the 0800–0FFF hex range. No operating system or file system exists to abstract this space. Instead, the program code and data share the same limited RAM alongside the stack and display logic. This constraint encourages developers to write compact programs and maintain a disciplined approach to address management.
For the Debug80 environment, this simplicity ensures that memory behaves as a concrete rather than abstract resource. The debugger presents the entire address space directly to the user. Every change to a memory location carries immediate meaning because no background activity or hidden consumers compete for the system state.
I/O as the system boundary
All interaction with the outside world passes through a small number of Z80 I/O ports. Port 0 handles input by reading the 20-key hexadecimal keypad. The system also uses the higher bits of this port for bit-banged serial input. While key presses can trigger a non-maskable interrupt for immediate response, many programs rely on polling to keep control flow explicit and predictable.
Output functions concentrate on Ports 1 and 2. Port 1 selects the active display digit and controls additional components such as the speaker and bit-banged serial output. Port 2 drives the seven-segment display data and the decimal point. Because the hardware requires software-based multiplexing, the scanning loop remains a visible component of program execution with observable timing consequences. From a platform perspective, display output represents a core behaviour that Debug80 must model with absolute accuracy.
The keypad as a control surface
The TEC-1 keypad defines the physical interface and how a developer uses the machine. It includes hexadecimal keys from 0 to F for data entry, alongside specialized function keys. The AD key toggles between address and data modes, while GO initiates execution from the current address. Users increment or decrement addresses using the + and - keys. A dedicated hardware RESET key returns the system to its initial state.
Programming on this platform remains an iterative and physical process. A developer selects addresses and enters bytes before starting execution and observing the results on the segmented display. While the monitor software supports this workflow, the programmer maintains the essential mental model. Debug80 informs its own execution control via this interaction style, even when software views replace the physical keypad and display.
Platform modules in Debug80
Debug80 models each machine as a distinct platform module that defines the memory layout and I/O port behaviour while specifying attached devices and timing assumptions. The TEC-1 module includes full software emulation of the hardware. This covers keypad scanning and display multiplexing alongside speaker output and bit-banged serial communication. Every instruction executes entirely within this precise emulated environment.
Alongside the TEC-1, the project maintains a minimal simple platform. This intentionally stripped-down Z80 system provides only serial input and output. It serves as a baseline and a development aid that allows for the exercise of debugger features without the overhead of device complexity. By testing against this simple model, I can ensure the core debugger logic remains sound before moving to more complex hardware.
Incremental expansion
The current platform model enables support for other classic Z80 machines as the project evolves. Some platforms attract interest because of their excellent hardware documentation. In other cases, developers can adapt existing software emulation for debugger use. Each addition brings both opportunity and technical cost that requires careful examination.
Hardware behaviour requires deep understanding, and every device requires a thorough model to ensure accuracy. Furthermore, I must evaluate the assumptions present in existing emulation code before integration. For these reasons, Debug80 expands its platform support deliberately and incrementally. The TEC-1 establishes the baseline for this growth: a small, complete machine where the developer can account for every single interaction.
The Debug80 architecture functions as a small and tightly integrated system. It combines a JavaScript-based Z80 assembler with a software execution model. The standard VS Code debugging interface sits on top to provide user control. Each component plays a specific functional role, and the ultimate value of the system depends on the precise alignment of these responsibilities. The development of Debug80 concentrates on integration rather than the invention of new core technologies. Because the underlying pieces already exist and remain well understood in the industry, the primary challenge involves connecting them in a way that respects the realities of Z80 programming. This integration ensures that execution remains observable and meaningful within a modern development environment.
VS Code as the execution host
VS Code provides a mature debugging framework that defines how the environment launches programs and how the user controls execution. The framework already exposes the essential operations needed for stepping through code and inspecting state. Debug80 adapts this framework directly to a Z80 execution context.
When a debug session starts, VS Code drives execution through its standard mechanisms while the actual processor and memory run inside the internal software model. From the user’s perspective, Z80 machine code participates naturally in the same debugging workflow used for contemporary high-level languages. This approach allows the project to concentrate on machine behaviour and hardware state rather than building a custom debugger interface from scratch.
asm80 and the role of listings
The system utilizes asm80, a Z80 assembler implemented in JavaScript for Node. This tool produces machine code alongside listing files. These listing files record exactly how source lines correspond to assembled addresses and bytes. They form the central input for Debug80 because they capture the assembler’s decisions directly without any reinterpretation. Debug80 uses these listings to establish a precise relationship between source text and generated machine code. This mirrors the traditional workflow of Z80 development, where the listing represents the bridge between the programmer's intention and the machine's reality. By treating the listing as a primary source of truth, the system ensures that the debugger always accurately reflects the assembled output.
Mapping source to execution
While the VS Code debugger operates in terms of source locations, the Z80 processor operates entirely in terms of memory addresses. Debug80 connects these two disparate views by generating explicit mappings from the assembler listings. These mappings relate source files and line numbers to assembled addresses. They also relate them to runtime instruction execution.
Breakpoints and stepping pass through this critical mapping layer. State inspection depends on it as well. When execution stops, the system shows exactly where the processor resides and how that location corresponds to both the original source and the assembled binary output. Mapping remains a structural foundation of the system rather than a secondary convenience, and much of the debugger's core behaviour depends on its accuracy.
Initialisation and workflow
The design of Debug80 prioritises minimal friction during setup and daily use. Since the core pieces all use JavaScript, the project simplifies distribution. This architecture runs across the major desktop platforms. The extension coordinates the build step and the launch step into a single workflow.
This integration means that editing source code and observing execution happen within one environment using familiar controls. While the underlying complexity of the machine remains visible to the developer, the system organises the information into a coherent structure. By consolidating these disparate tools, Debug80 allows the programmer to focus on the logic of their program rather than the mechanics of the toolchain.
Execution under debugger control
During a debug session, the Z80 processor and all attached devices execute within the software model. Machine execution advances under the direct control of the VS Code interface. The interface routes execution control through the same mechanisms on every platform, so the user sees a consistent machine state.
The debugger actively drives the execution process rather than simply observing it from the outside. At every step it exposes the registers and memory for examination. The I/O state stays visible as well. This deep integration ensures that the tool behaves like a first-class debugger for an 8-bit architecture, providing the same level of control one expects from modern software development tools.
System coherence
Taken together, Debug80 forms a coherent environment rather than a loose collection of disparate tools. The assembler establishes the ground truth of the machine code while the platform model defines the hardware behaviour. The debugger interface supplies the control and visibility. Every component reinforces the others to maintain a consistent user experience. The emphasis throughout the project remains on architectural alignment and keeping the number of moving components small. This strategy allows low-level programming to remain approachable for a wider audience. By providing a clear window into the machine's internal state, Debug80 recovers the clarity of early computing within a modern context.
Z80 programs execute at specific addresses while developers author code in source files. Understanding is either preserved or lost in the space between these two views. In the Debug80 environment, the assembler listing occupies that critical gap.
The assembler used by Debug80, asm80, produces listing files that record how source text expands into bytes at specific addresses. These files remain simple and direct because they show the assembled output exactly as it will appear in memory. Debug80 treats these listings as primary input rather than secondary artefacts.
Why listings matter
A listing captures a moment of agreement between developer intention and machine execution. It records which source line produced each byte at its final address. This information remains precise even when the source language expands into generated code.
Because of this precision, listings provide a reliable foundation for mapping. They allow Debug80 to reason about execution without guessing how the assembler interpreted the original source. The resulting mapping reflects what actually happened during assembly. This approach aligns with traditional Z80 development practices, where programmers worked directly from listings and read the machine output alongside their source. Debug80 builds on that legacy while extending the concept into a live debugging context.
Building the mapping
From the listing output, Debug80 constructs a set of explicit relationships. It links source files to assembled address ranges. Line numbers fill in the rest of the map down to instruction boundaries. These relationships form a mapping table that bridges the text editor and the execution engine.
The mapping process remains mechanical and deterministic because it follows the assembler’s output without relying on inference. When execution reaches a particular address, the debugger identifies the corresponding source location. When a user sets a breakpoint on a line of source, Debug80 resolves that location to one or more concrete machine addresses.
Stepping with intent
Stepping through a Z80 program involves more than simply advancing the program counter. Instructions vary in length, and macros or pseudo-operations often expand into multiple machine instructions. Furthermore, some source lines correspond to no emitted machine code at all.
The mapping layer allows Debug80 to step through code in ways that respect the source structure. A single step can advance execution to the next relevant source line, even when the operation involves multiple instructions.
At the same time, the underlying address-level execution remains visible and accessible to the user. This dual view supports reading the program as written while still inspecting the machine as it runs.
Breakpoints and visibility
Breakpoints operate through this same mapping layer. When a developer sets a breakpoint in the editor, Debug80 resolves it to the appropriate machine addresses based on the listing data. When execution reaches one of those addresses, the debugger stops so that the developer can inspect the current machine state.
Because the mapping remains explicit, the debugger shows how the stopped location relates to the source. The assembled output remains visible beside it. The user can then inspect registers and memory along with the I/O state to gain a clear understanding of exactly how the program arrived at that point.
Mapping as structure
Debug80 treats mapping as a structural foundation rather than a convenience feature. This layer influences how the system controls execution and presents state while also affecting how the user reasons about a running program.
The assembler listing provides the raw material while the mapping layer organises it into a form that connects human intent to machine behaviour. This connection makes debugging effective in low-level systems where abstraction layers remain thin and consequences are immediate. This focus on explicit mapping remains central to Debug80’s design, allowing classic development practices to persist in a modern environment without losing their original clarity.
A debugger in VS Code lives in two distinct worlds. One world is the user interface, and the other houses the execution engine. The Debug Adapter Protocol (DAP) serves as the critical bridge between these two environments. For Debug80, building this connection started with a "skeleton"—a minimal implementation of the protocol that allowed VS Code to communicate with my Z80 runtime. This foundational layer established the basic dialogue needed to control execution from within the editor.
The common language of DAP
The Debug Adapter Protocol provides a standardized way for editors to interact with debuggers. Instead of developers writing custom interfaces for every language, VS Code requires a debug adapter to handle a small set of requests so the editor can control execution. This abstraction allows me to focus on Z80 specific logic while VS Code handles the heavy lifting of the graphical interface. When a user clicks the margin to set a breakpoint, VS Code sends a setBreakpoints request. My adapter translates that request into a machine address. The engine stops when it reaches that location.
Why I chose an Inline implementation
Debug adapters typically run as separate processes to provide stability, as a crash in the debugger will not take down the editor. However, Debug80 utilizes an "inline" implementation where the adapter runs directly inside the extension process. I chose this approach to simplify communication with my custom UI panels. Running inline avoids the need for complex inter-process communication when synchronizing the machine state with the visual hardware representation. This tight integration keeps the TEC-1 display in sync with the underlying code execution.
Activation and the Resolution cycle
The lifecycle of a Debug80 session begins with activation. In the package.json manifest, I instruct VS Code to activate my extension whenever a user requests a z80 debug type.
"activationEvents": [
  "onDebugResolve:z80"
]
When a user initiates a session, VS Code triggers an initialization handshake. The adapter responds with a capabilities description so VS Code can drive the session. Once this handshake completes, the environment is ready to load the Z80 program. The execution cycle then bridges the final gap between the static JSON configuration and the live machine.
The Z80DebugSession
The heart of the skeleton resides in the Z80DebugSession class. This component inherits from the standard DebugSession base and acts as a central coordinator for the entire system. It manages the runtime state by using the mapping data I established in previous articles to route commands directly to the CPU engine.
By implementing this backbone first, I created a stable platform for the more complex work that follows. With the skeleton in place, I could finally begin the technical task of simulating the Z80 heartbeat—the execution loop that truly brings the machine to life.
This structural readiness allowed me to transition from protocol management to physical system simulation without revisiting my architectural assumptions.
Constructing the Core: Foundations of a Z80 Debugger
Building a debugger for a legacy architecture like the Z80 within a modern environment like VS Code requires more than just an emulator. It requires a stable, high-level interface that can translate abstract debugging commands into concrete machine actions. This article documents the foundational phase of the Debug80 project. I focused on the Debug Adapter Protocol (DAP). After that, I integrated the asm80 assembler into a unified workflow.
The Debug Adapter Protocol (DAP)
The Debug Adapter Protocol is the standard that allows VS Code to communicate with different debuggers. By implementing this protocol, Debug80 can use the full suite of VS Code’s debugging UI without needing to build a custom frontend. That contract brings core UI features without extra work. The heart of this implementation is the Z80DebugSession class, which extends the standard DebugSession base class to handle requests and manage the Z80 runtime lifecycle.
export class Z80DebugSession extends DebugSession {
  private runtime: Z80Runtime | undefined;
  // ... other state

  protected async handleLaunchRequest(
    response: DebugProtocol.LaunchResponse,
    args: LaunchRequestArguments
  ): Promise<void> {
    // Initializing the session
    this.runtime = undefined;
    this.breakpoints.clear();

    // Establishing the workflow...
  }
}
The launchRequest is the entry point for any session. It parses the user's configuration and uses that to locate the binary artifacts before bringing the Z80 runtime online. This is the moment when a static configuration turns into a live debugging session.
Closing the Loop: Integrating asm80
A significant hurdle in early Z80 development was the "disconnected loop." Developers would typically assemble their code in a standalone terminal. They would check the output for errors, then manually load the resulting HEX file into a separate debugger. I wanted Debug80 to provide a contemporary "F5" experience, where pressing a single key would build and debug the project seamlessly. This meant the debugger had to be aware of the source code and capable of running the assembler itself before starting the session.
I chose asm80 for its reliability and modern JavaScript-based implementation, which fits naturally into a VS Code extension. The integration ensures that every time a debug session starts, the code is fresh and the mapping information remains accurate. It removes the manual step that used to drift out of sync.
By automating this step, the debugger keeps the assembled artifacts in sync with the .asm source files. This synchronization is critical for the next stages of development, where source-level mapping keeps breakpoint placement accurate. That alignment is what makes stepping trustworthy.
Configuration and Discovery
To make the system flexible, I implemented a configuration discovery mechanism. While users can provide explicit paths in their launch.json, the preferred method is a repository-level debug80.json file. This file defines the hardware layout, making the debug setup portable across different developer machines. It keeps project configuration readable and in one place.
When a session starts, Z80DebugSession looks for this file and merges its settings with the launch arguments. This allows for a minimal "zero-config" start for projects that follow a standard layout. I wanted new projects to start without a pile of boilerplate.
Conclusion
Establishing this foundation mattered because it turned a pile of components into a single debugging pipeline. I now had a clean DAP implementation. The assembly loop was built-in and ready for daily use. The configuration system kept setup small and predictable. It transformed the Z80 from a black box into a controllable environment. In the next article, I will explore how I brought transparency to that environment through terminal I/O. I will also show how register state becomes visible in the same flow. Hardware abstraction then lets us map abstract instructions to real-world interface interactions.
Bringing Legibility to Execution: Terminal I/O and Register States
A debugger that only tracks memory addresses and hex codes is an exercise in mental overhead. To be useful, a debugging environment must provide a legible high-level view of the machine’s state and a way to interact with its execution. In the second phase of Debug80’s development, I focused on register formatting and terminal I/O so the machine state could be read at a glance.
The I/O Handler Interface
At the core of Debug80’s hardware abstraction is the IoHandlers interface. This interface allows the VS Code debug adapter to intercept Z80 IN and OUT instructions and route them to modern UI components, such as the VS Code Terminal panel.
By providing custom handlers to the Z80Runtime, we can emulate a terminal by mapping specific ports to the debug session's state. When the Z80 emulator encounters an OUT (P), A instruction, it triggers the registered write handler. In the case of the "Simple" platform, the handler redirects this write to the VS Code terminal through a DAP OutputEvent.
This simple mapping turns the abstract OUT instruction into a real-time character on the screen, so output appears directly in the VS Code environment.
The Z80 has a unique register set with shadow pairs and index registers that don’t show up clearly in a raw hex block. Seeing these in a raw hex block is tedious. I wanted the VS Code Variables view to feel like a purpose-built Z80 dashboard. To achieve this, I implemented a heavy formatting layer in the variablesRequest handler. This layer converts the numeric register values into formatted hex strings. It also expands the flag byte into named bits so the state reads as letters instead of numbers.
By displaying flags like szhPNC, the developer can instantly see that the Sign and Parity/Overflow flags are set while the Carry flag is clear. This high-density information is essential for reasoning about the complex branching logic common in Z80 assembly.
The "Terminal Break"
Interaction isn't just about I/O; it's about control. I implemented a "Terminal Break" feature using custom DAP requests. When a user presses a specific key combination in the terminal, the adapter can signal the Z80 runtime to halt, effectively providing a "Pause" button that is sensitive to the user's interaction point.
Conclusion
By making the Z80’s state legible and its I/O interactive, Debug80 moved from being a simple emulator to a functional development tool. However, even with great visibility, writing assembly remains a challenge of organisation. In the next article, I’ll detail the "Caverns Saga"—a journey into organising complex assembly logic through data tables and declarative rules.
While building the Debug80 environment, I needed a non-trivial project to test its limits. I chose to port an old adventure game to Z80 assembly: Caverns. What started as a simple exercise quickly became a lesson in assembly project management. As the codebase grew past 2,000 lines the "standard" approach of monolithic files and hardcoded logic became unscalable. I had to rethink the architecture, moving toward a modular, data-driven system.
Modular Architecture: The "Great Unbundling"
The first step was breaking the project into logical components. In Z80 assembly, without a high-level linker, I leaned on INCLUDE directives to keep shared values in one place. Symbolic constants did the same for literal values across files. Each file would have a clear single responsibility, which made the codebase easier to navigate and maintain. I split the code into four anchors. main.asm holds the entry point for the game loop, which keeps startup logic in one place. game.asm handles the command verbs for player input. tables.asm carries the movement grids that drive navigation. Object locations live there as data, not logic. strings.asm collects the textual data so I could change wording without touching logic.
The Declarative Rule Engine
Instead of writing complex if/else logic for every room, I moved the world logic into data tables. This "rule engine" approach allowed me to define the entire map in a single, compact table. It also forced me to name every transition explicitly, which exposed missing links early.
; From src/tables.asm
movementTable:
    ; Room 1: Forest Clearing (North, South, West, East)
    DB roomForestClearing, 0, 0, 0
    ; Room 2: Dark Forest
    DB 0, 0, roomDarkForest, roomCloverField
    ; ...
The movement logic then becomes a generic lookup. The system takes the current room ID. It finds the matching row in the table and jumps to the destination listed for the player's direction. This approach eliminated hundreds of lines of conditional branching and made the game world trivially easy to modify or expand.
Orderless Input Scanning
One of the most modern-feeling features of the port is the input parser. Traditional Z80 parsers are often rigid, expecting "VERB NOUN" in exactly that order. In Caverns, I implemented an orderless token scanner. The scanner pads the input with spaces, then searches for matches against the verb table. It repeats the scan against the noun table.
; From src/game.asm
scanInputTokens:
    ; ...
    ; Scan verbs (first match wins)
    LD IX, verbTokenTable
    LD B, verbTokenCount
sv_loop:
    LD E, (IX+0)
    LD D, (IX+1)        ; DE = token ptr
    LD HL, inputBuffer  ; HL = input string
    CALL containsTokenCI
    JR Z, sv_hit
    ; ...
The engine looks for padded tokens such as " GET ". It treats "TAKE" in the same way. Order no longer matters, so the parser treats different word orders as equivalent. This flexibility makes the game feel more intuitive than a typical 8-bit title.
Dynamic Exit Patching
Static tables are great for fixed geometry, but adventure games need changing worlds. I implemented a dynamicExitPatchTable that allows the game state to modify the movementTable at runtime. I kept the table small so I could audit it by hand.
; From src/tables.asm
dynamicExitPatchTable:
    DB roomBridgeNorthAnchor, dirSouth
    DW bridgeCondition  ; Variable holding the runtime destination
When the player lowers a bridge, the game updates the bridgeCondition variable. A periodic system routine reads this table and "patches" the movement logic, opening a new path for the player. That change happens without rebuilding the map tables, which keeps the runtime logic simple.
Conclusion
The Caverns port proved that complex software on the Z80 is a matter of data organization. I treated the processor as an executor for data-driven rules rather than a bucket for branching logic. This kept the project manageable and easy to test. Next, I will show how I solved the "legibility" problem by mapping these complex assembly files back to the debugger's source view through the D8 Mapping Specification.
In modern web development, source maps are a given. We write TypeScript, and the debugger maps execution back from the transpiled JavaScript without extra work. In the world of 8-bit assembly, no such standard exists. A typical assembler produces a .hex file for execution. It also emits a .lst (listing) file for human reading. To give Debug80 the "Source-Level" feel (the ability to click a line in an .asm file and set a persistent breakpoint), I had to build a translation layer known as the D8 Mapping Specification.
The Problem: Listing Ambiguity
An assembly listing file is a textual representation of the assembly process. The listing pairs each source line with its emitted bytes at a specific address. Parsing these files on the fly during a debug session is slow. Listings turn ambiguous when macros or INCLUDE directives appear. I needed a more structured approach built for lookup, not for human reading.
That format needed to support quick runtime queries while staying portable across machines. Multi-file projects also had to work without forcing a custom parser into the runtime.
The Solution: The D8 Debug Map
The D8 Debug Map is a JSON schema that acts as a pre-indexed cache of the assembly process. This schema transforms the linear listing into a file-centric hierarchy, which makes lookups fast and reliable. That change moves the heavy parsing work into the build step, where it belongs.
By grouping segments by their original source file, the debug adapter can instantly resolve a Program Counter (PC) address to a specific line in a specific file. This eliminates the need for linear scanning. Breakpoint resolution becomes nearly instantaneous in practice. It also means every lookup has a clear owner, which simplifies the adapter’s logic.
The Concept of Confidence
One of the most useful features of the D8 spec is the use of "Confidence Levels." Because the mapping between machine code and source is not always one-to-one, I introduced the D8Confidence type for cases where directives inline data. It lets the mapper assign a level of certainty to each file entry based on how direct the mapping is.
A High confidence level means the address is explicitly mapped to a specific line of code. Medium indicates the mapper has guessed the line based on surrounding context. Finally, Low serves as a fallback match where the address falls within a file's range.
This allows the UI to remain helpful; by moving the instruction pointer to the closest "best guess" line, the debugger avoids failing when a precise match is missing. The goal is graceful behaviour even when the listing cannot provide a perfect answer.
Pre-Indexing for Performance
Early versions of Debug80 parsed the .lst file on every launch, but for a project like Caverns with thousands of lines, this added a noticeable delay. With the D8 spec, the assembly process generates the .d8.json file. The adapter then simply performs a JSON.parse(). If the file is missing or stale compared to the listing, the adapter regenerates it automatically. That keeps mapping accurate without a performance penalty.
Conclusion
The D8 Mapping Specification is the glue that makes Debug80 feel like a modern tool. It handles the messy reality of assembly listings. The interface it provides for the VS Code editor stays clean and fast. With the code mapped, it’s time to look at the next frontier: simulating real hardware. In the fifth article, I’ll explore the world of cycle-accurate timing and the TEC-1 hardware periphery.
Simulating Hardware: TEC-1 and Cycle-Accurate Timing
In the initial versions of Debug80, the emulator ran as fast as the host processor allowed. While great for performance, this was disastrous for hardware fidelity. Legacy hardware like the TEC-1 depends on exact timing for everything from the pitch of its speaker to the stability of its bit-banged serial communication. To solve this, I had to move away from real-time clocks and implement a system of cycle-accurate timing.
The Problem with Real-Time
If you use Date.now() to time a 4MHz Z80, you are at the mercy of the host OS's scheduling jitter. A 16ms delay might actually be 20ms or 30ms. This variance is unnoticeable to a human but fatal for a 9600 baud serial routine. The solution is the CycleClock, a time base that counts CPU cycles instead of milliseconds. It measures T-states—the internal clock cycles of the Z80 CPU.
The CycleClock Implementation
The CycleClock is a deterministic scheduler that advances time by counting CPU cycles. Every instruction executed by the CPU returns the number of cycles it consumed, such as 4 cycles for NOP or 17 for CALL. We then advance the clock by this specific amount.
By scheduling events at specific cycle marks, we ensure that peripherals behave exactly the same way every time the code runs, regardless of how fast the host machine is.
Emulating the TEC-1 Periphery
The TEC-1 is a minimalist machine without a dedicated display controller or a UART chip. Instead, the CPU handles everything by toggling bits on an I/O port. For the display, the hardware works by latching segments and then selecting a digit. The tec1/runtime.ts intercepts writes to ports 0x01 and 0x02, storing the latched values until the CPU toggles a "digit select" bit.
Bit-banged serial was perhaps the biggest challenge. On a real TEC-1, the MON1 ROM bit-bangs the serial lines. To support this in emulation, I implemented a BitbangUartDecoder that "watches" the I/O port. Because we use cycle-accurate timing, the decoder can know exactly when a start bit begins and sample the subsequent bits at the precise intervals required for 9600 baud.
Audio Fidelity and the Silence Watchdog
Toggling a speaker bit produces audio on the TEC-1. The Z80 produces a 400Hz tone by toggling the bit 800 times in a simulated second.
// From src/platforms/tec1/runtime.ts
if (speaker !== state.speaker) {
  const now = state.cycleClock.now();
  if (state.lastEdgeCycle !== null) {
    const delta = now - state.lastEdgeCycle;
    state.speakerHz = Math.round((state.clockHz / 2) / delta);
  }
  state.lastEdgeCycle = now;
}
To prevent audio from "sticking" when the CPU halts, I implemented a "silence watchdog" that schedules a silence event. Every time the speaker toggles, it schedules an event a few thousand cycles into the future. If the CPU stops toggling, the watchdog triggers and clears the tone.
Conclusion
Cycle-accurate timing transformed Debug80 from a software emulator into a hardware simulator. It allowed me to run original ROMs without modification and experience the machine exactly as it behaved in 1983. In the final article of this series, I will discuss the "Great Unbundling"—how I modularized the project to support an entire ecosystem of platforms while keeping the core debugger lean and stable.
As Debug80 reached maturity, it faced a classic architectural crossroads. We started with a simple debugger and quickly added support for the TEC-1 platform. ROM loaders and example games like Caverns followed. The repository was becoming a "mono-blob" that cluttered the codebase with machine-specific binary data and logic. To ensure the long-term stability of the core debugger, I initiated what I called "The Great Unbundling."
Debug80 TEC-1 interface, January 23, 2026.
This capture shows the interface state that framed the unbundling work.
Identifying the Core
The core of Debug80 is the VS Code Debug Adapter Protocol (DAP) implementation plus the Z80 emulator. I treat everything beyond that as peripheral. That peripheral layer includes the TEC-1 ROMs and its RAM initialization files. Scalability meant that a developer should be able to use Debug80 for any Z80 project without the core repository needing to know about that project's specifics.
The Role of debug80.json
The bridge between the generic core and the specific platform is the debug80.json configuration file. Instead of hardcoding platform memory details in the TypeScript source, I moved them into a declarative per-project configuration. This shift allowed the debug80 repository to delete several hundred kilobytes of binary ROM data and machine-specific code.
Decoupling the Ecosystem
With the core now generic, specific platforms can live in their own repositories. debug80-tec1 contains the TEC-1 specific monitor code and configuration templates. caverns80 owns its game logic and assembly organization. When a developer wants to debug a new machine, they don't need to submit a PR to the main Debug80 repo. They create a new repository and include debug80 as a tool, along with their own debug80.json.
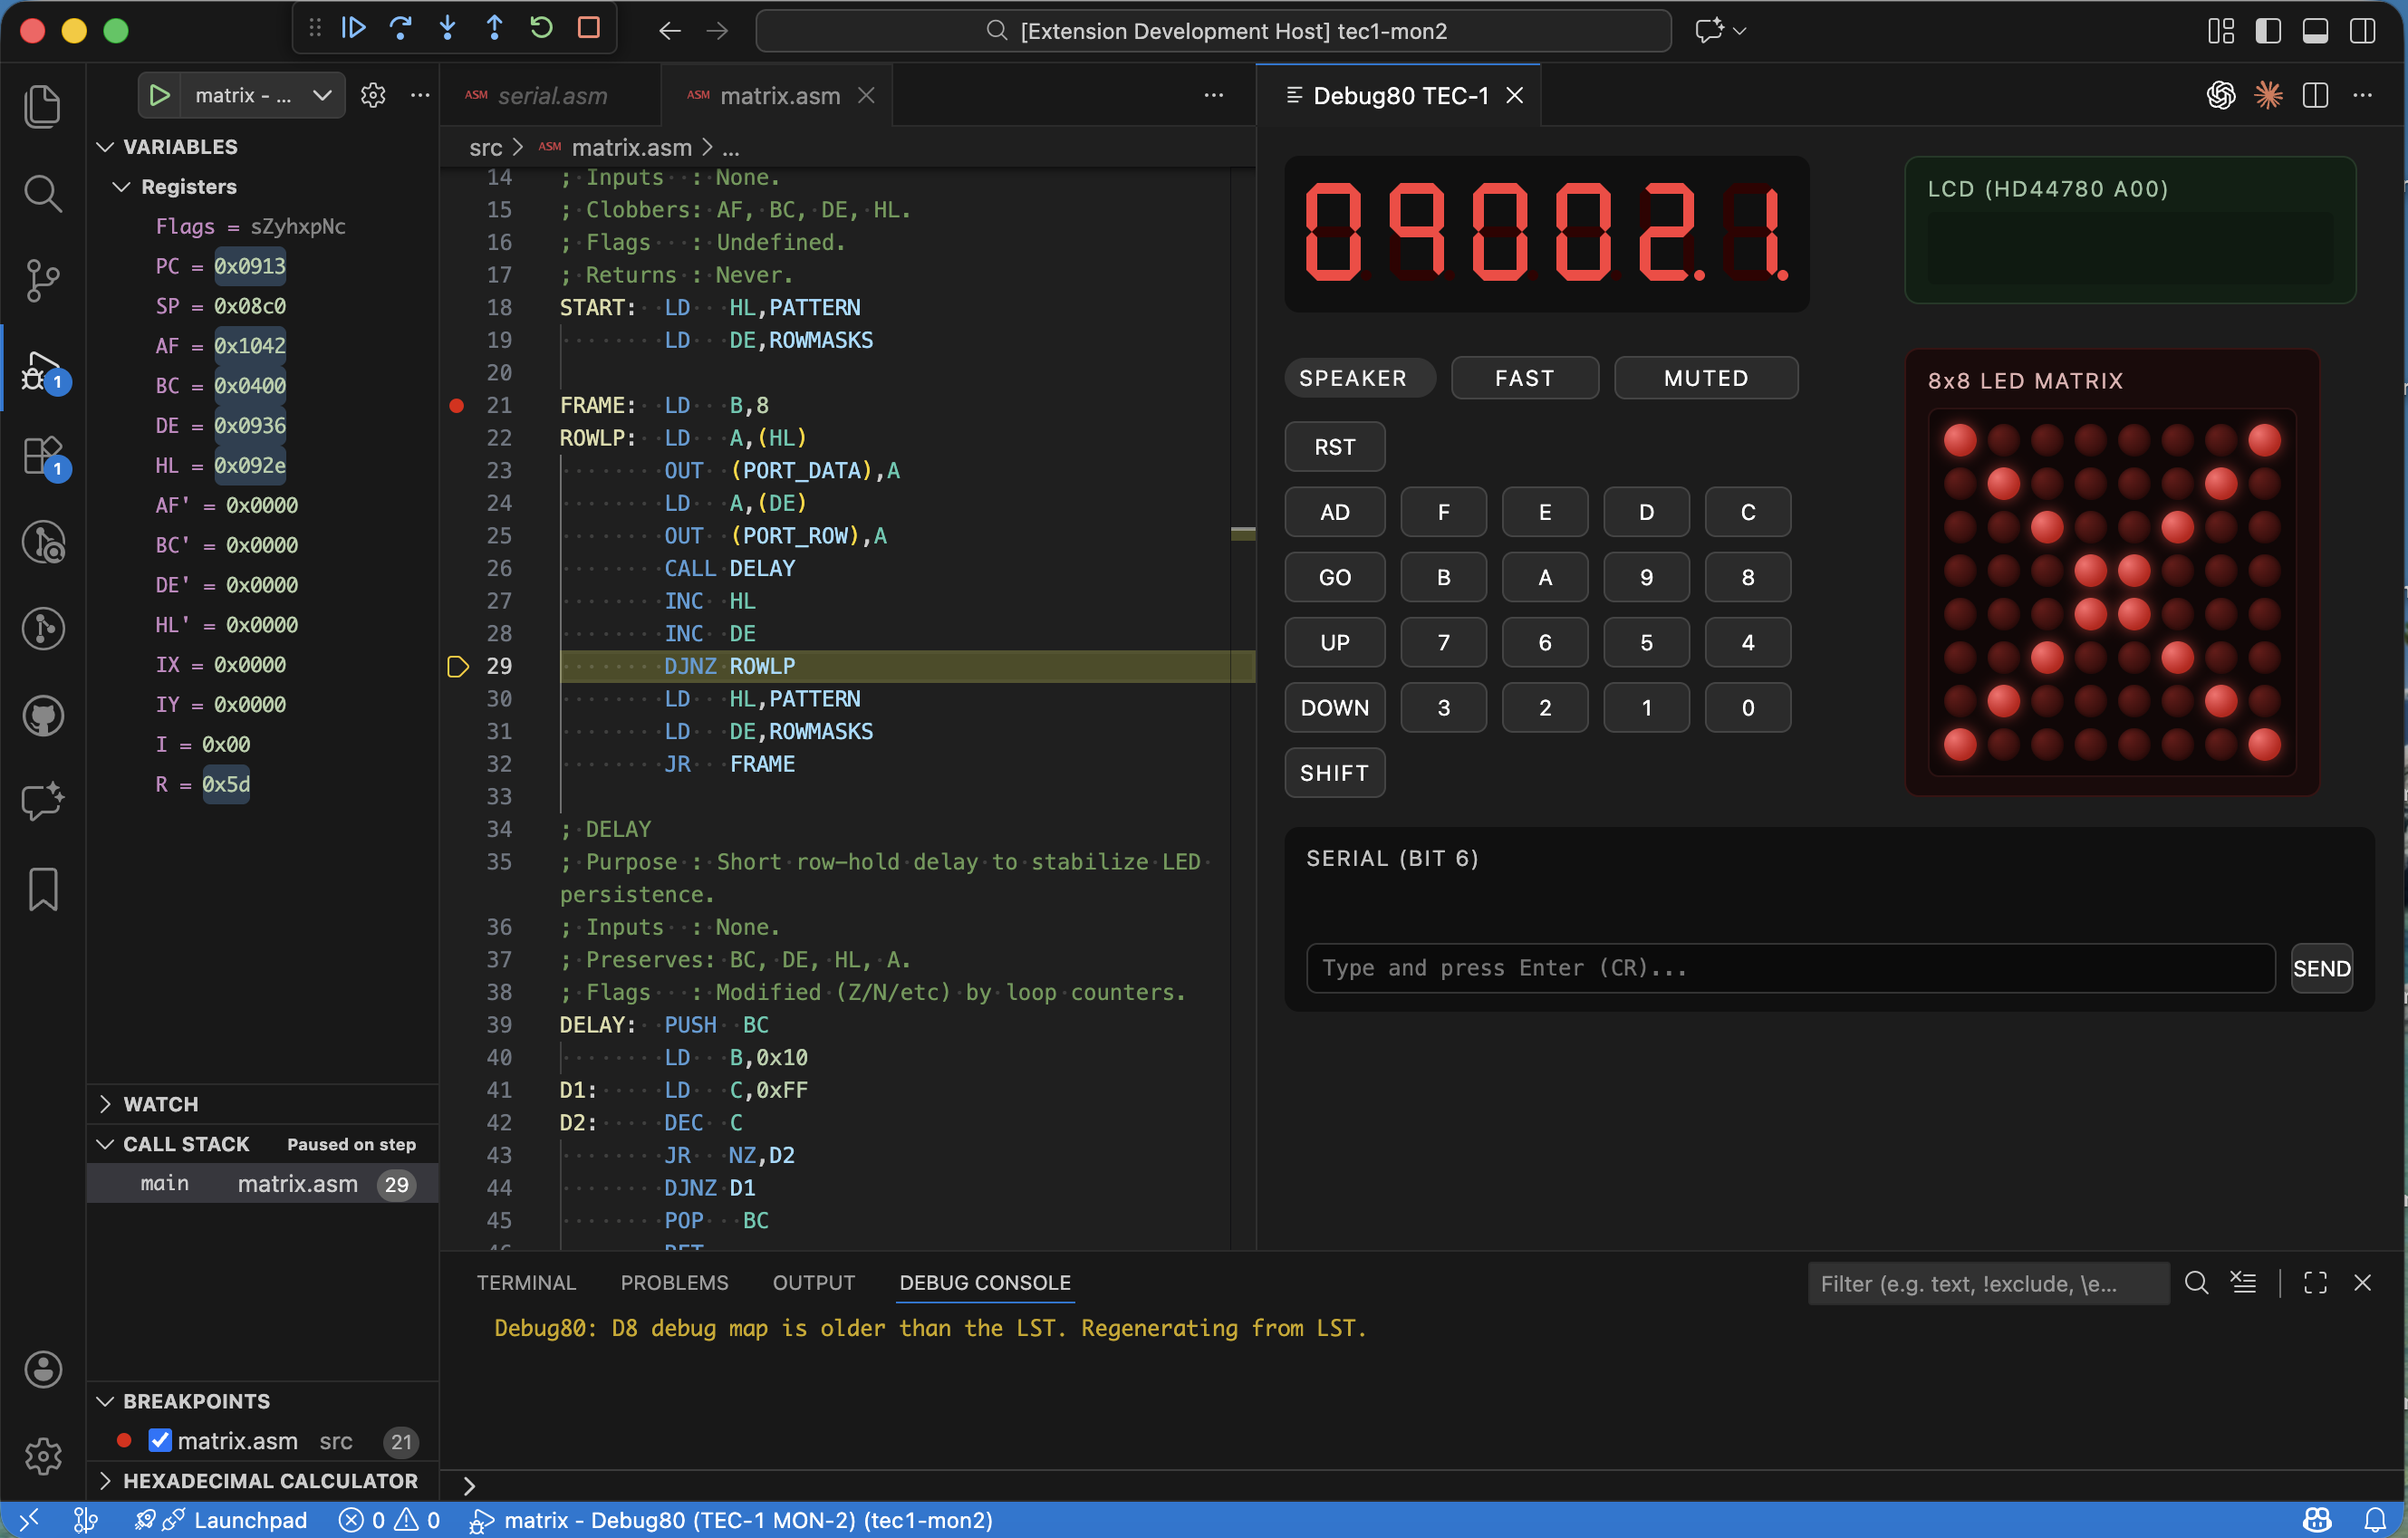
I wanted a place where I could read the machine state directly. Registers are fine, but they do not show what the bytes around them look like. When I was stepping through programs I kept jumping between the listing and the hex view in my head. That is when I decided to build a dedicated memory panel for the TEC-1.
The first step was a new command, debug80.openTec1Memory. I built a webview that could sit beside the main TEC-1 panel. The adapter gained a custom request named debug80/tec1MemorySnapshot. It reads the current register set and chooses a centre address. It then returns a window of bytes around that address. The adapter aligns the window to the row size so the panel does not jitter as the pointer moves. A focus index marks the exact byte under the pointer, which lets the view highlight the address that triggered the snapshot.
The first version shipped with three views, with PC and SP fixed in place. The third view followed HL, with an optional absolute address override for quick jumps. The panel refreshes on a short timer so it stays in step during stepping and short runs. I did not want to force another button press every time I hit Step.
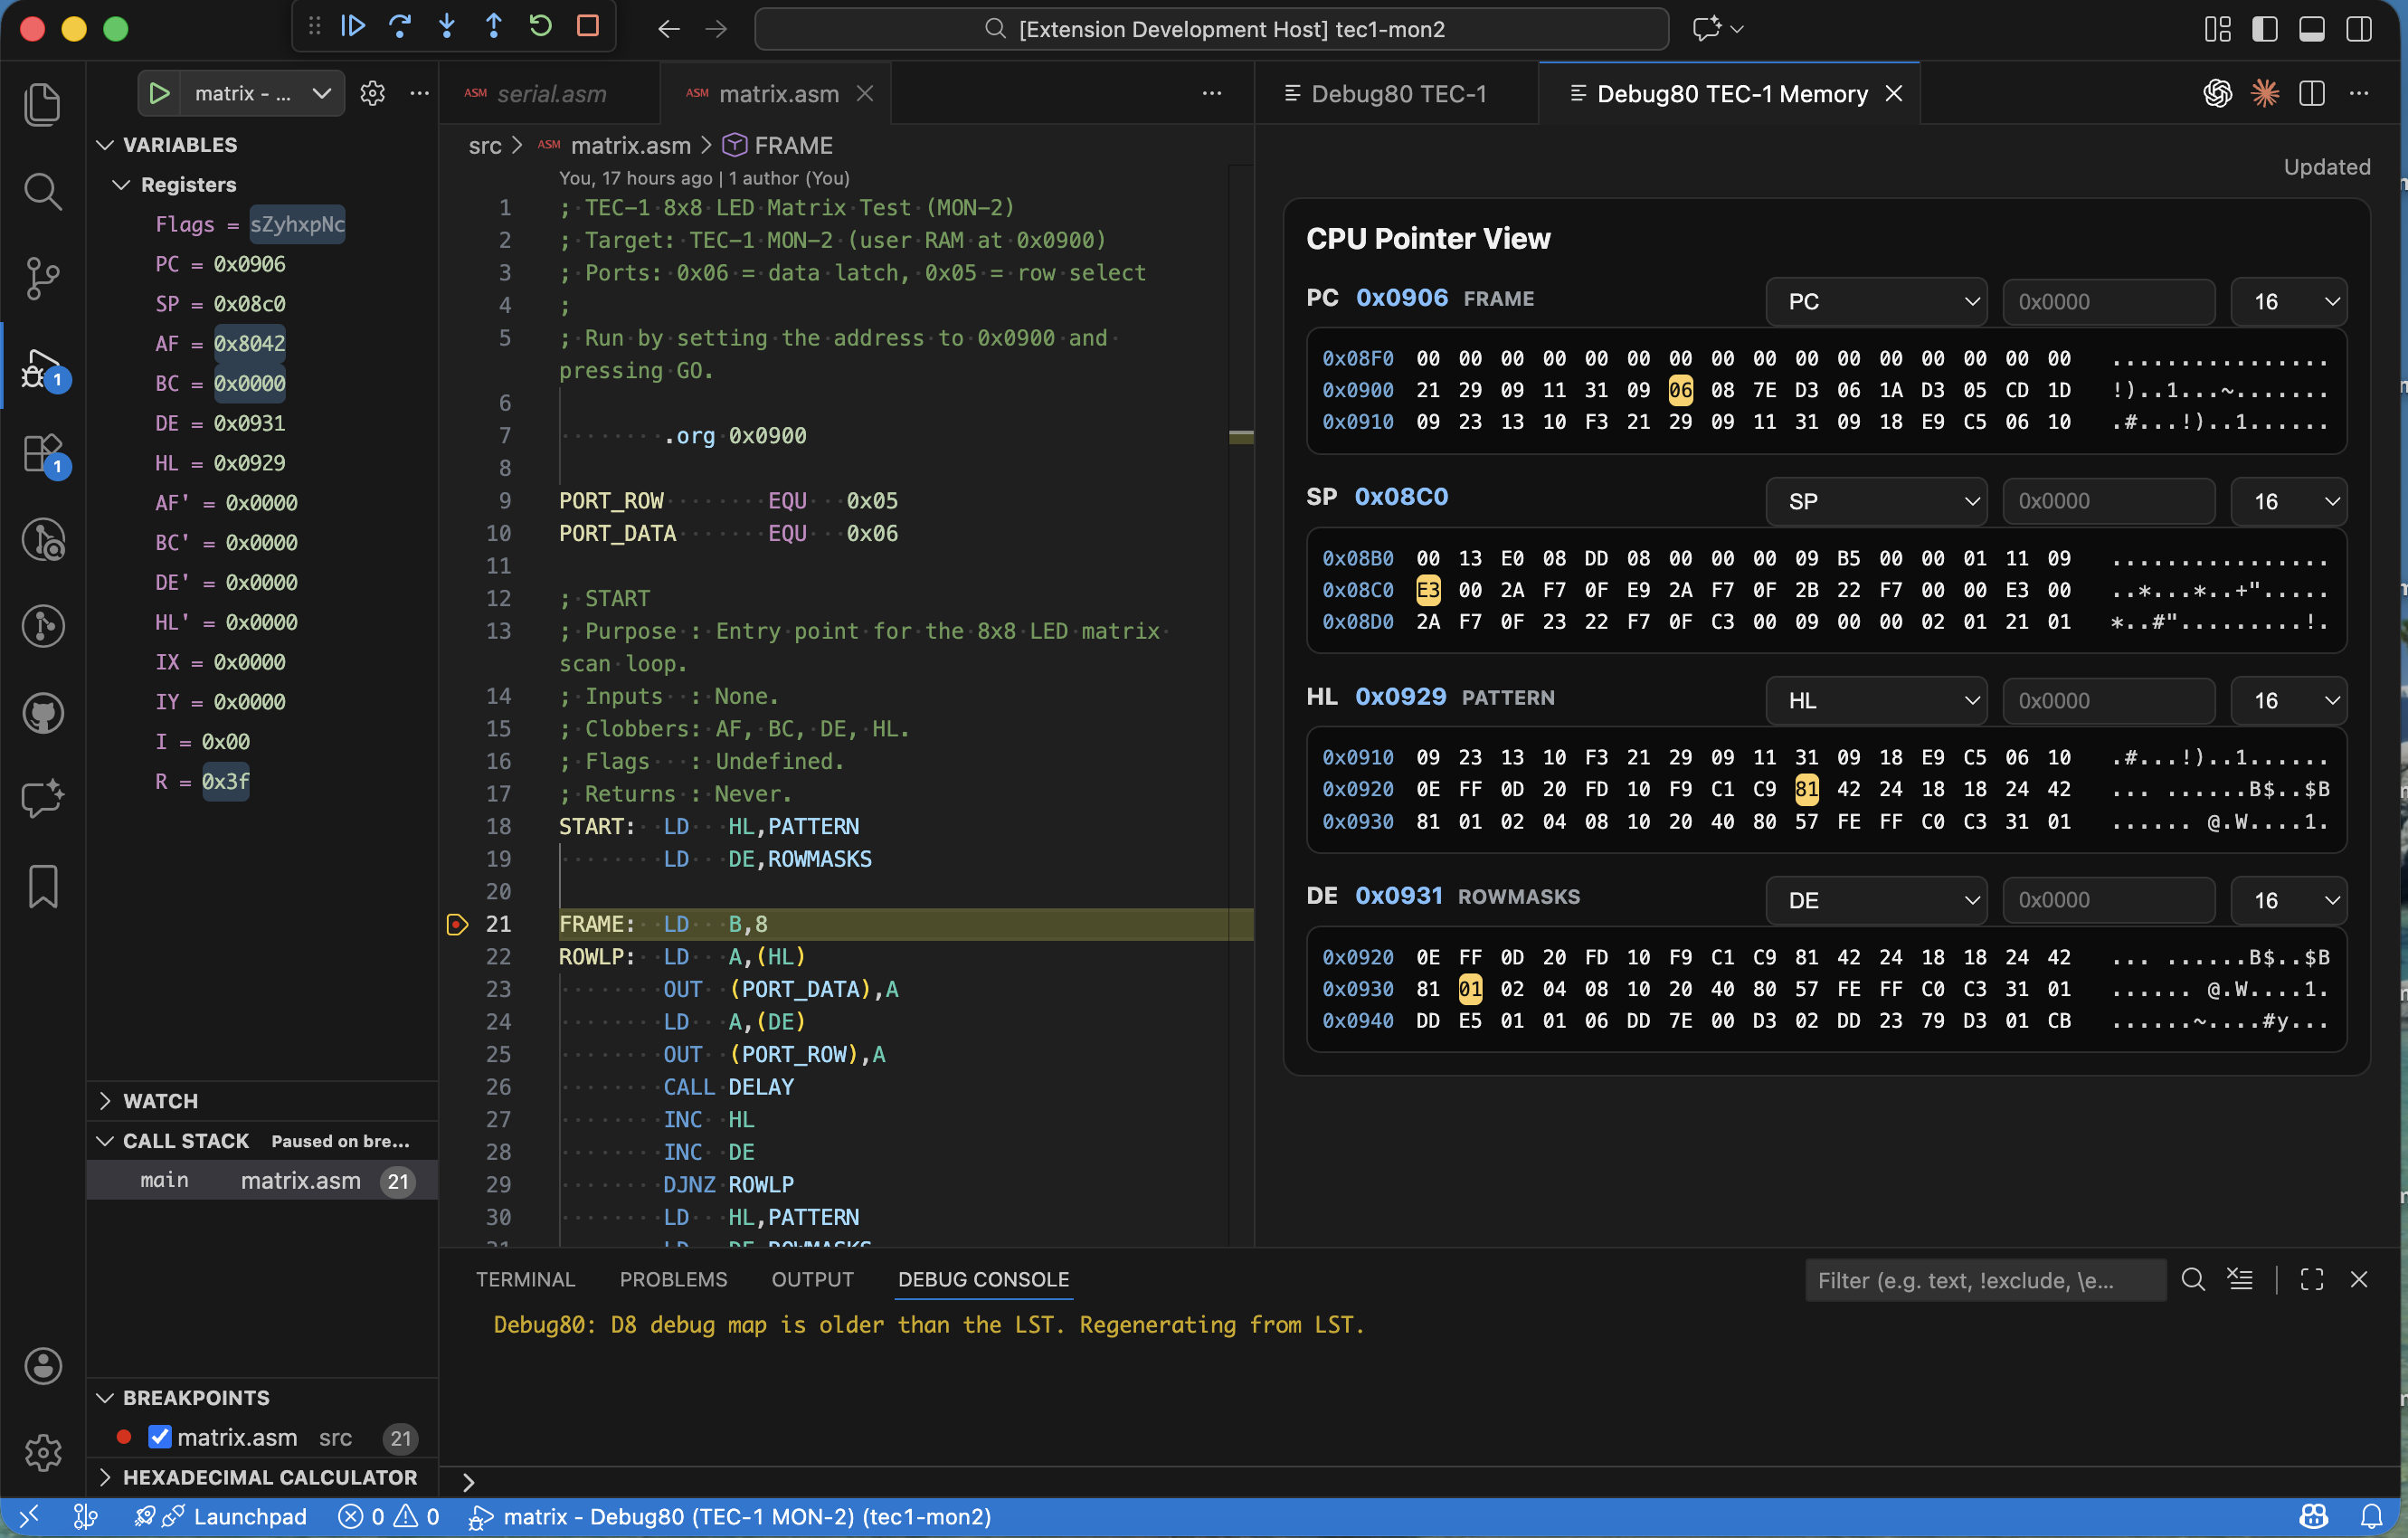
TEC-1 memory panel, January 23, 2026.
As soon as I started using it, the limits became obvious. A single view is not enough when the program counter and stack pointer move while a data pointer moves too. I rewired the snapshot payload to accept a list of views instead of a single view. Each view entry carries its own id and view mode. The window size is set per view. The adapter now produces a response that mirrors the list so the panel can update all views in one round trip.
That change made the panel a four-pane dashboard. PC and SP now sit beside HL and DE, each with its own window length. I kept the row size consistent and the alignment rules identical so the panes stay visually comparable. This is a small detail, but it matters when you are scanning two panes and trying to align addresses by eye.
The last piece was symbols, because I wanted to see where I was without opening the listing. The adapter now builds a symbol index when a session starts. If the mapping already has anchors, it uses them. If not, it parses the listing for lines like “DEFINED AT LINE”. It extracts the symbol name and address, then records the file for each line. I then sort those anchors and filter them against valid mapping ranges so I do not label bytes that fall outside the assembled segments.
The snapshot response now returns two symbol payloads. Each view includes the nearest symbol plus the offset from that symbol. The panel also receives the full symbol list, which it uses to add a symbols group to each view selector. When I choose a symbol, the panel resolves it to an absolute address and updates the view.
The memory panel started as a simple hex window, but it is now a surface that carries context. It is the closest tool I have to an always-on listing, and it makes the machine readable while the program is still in motion.
The TEC-1 work started inside the debug80 repo because I needed to move fast. That was the right choice for the first experiments, but it meant the core extension began to carry program bundles and ROM assets. It also had a loader UI that belonged to the platform, not the core debugger. The repo was beginning to feel like a platform pack instead of a core tool.
I removed the TEC-1 program loader and the programs/tec1 tree from the extension. That cut out the debug80/tec1LoadProgram request in the adapter. It also removed the program picker from the TEC-1 panel. The bundled serial and matrix demos went with it. The core debugger now focuses on the adapter. It still provides the runtime and UI surfaces, but it no longer owns machine content or program curation.
That removal forced the line between tool and platform. The answer was a new repo named debug80-tec1. It holds the machine setups and their assets. The structure is intentionally small so each machine reads like a runnable workspace. It has a MON-1 folder and a MON-2 folder. A shared ROM directory sits beside them. Each machine folder has a .vscode/debug80.json with named targets and a default target so the setup can be run immediately.
Both ROMs run on the same TEC-1 hardware. The difference is the memory map, not the machine itself. MON-1 user programs start at 0x0800. MON-2 user programs start at 0x0900 because MON-2 keeps variables and the stack in the 0x0800–0x08FF region. Each target declares ROM and RAM regions. It also declares the application start address and the ROM hex file to preload. The serial and matrix demos live alongside those targets in src/, which makes each machine folder a runnable workspace.
I also started tracking ROM binaries in git. The mon-1b.bin and mon-2.bin files sit next to their hex and source representations. That keeps provenance visible and makes the repo self-contained. It matters when the goal is a platform pack that works on any machine without extra downloads.
The split is more than a cleanup. It makes debug80 easier to maintain because the core stays focused on the debugger. The TEC-1 platform can evolve on its own cadence. It also sets a pattern for future platforms so they can keep ROMs and targets together in one place. Test programs can live beside them without bloating the core extension.
The TEC-1 was always a teaching machine that shipped with 2K of ROM alongside 2K of RAM alongside a hex keypad that taught you to think in machine code. The TEC-1G keeps that spirit but expands the hardware significantly by offering 32K of RAM alongside a 16K monitor ROM alongside an LCD character display alongside memory banking features that let programs grow beyond the original constraints. These are not incremental changes because they reshape how programs are written alongside how the debugger must behave. I could have stretched the existing TEC-1 platform to cover the TEC-1G but that would have buried the differences in conditionals alongside special cases. Instead I added a dedicated tec1g platform to Debug80 with its own memory map alongside its own I/O port handlers alongside its own panel UI. The two platforms share some low-level code but they present themselves as distinct machines with their own identity so this separation makes it easier to maintain accurate emulation for both systems without one platform's quirks affecting the other.
A Different Memory Map
The TEC-1 has a simple layout with ROM at 0x0000–0x07FF alongside RAM at 0x0800–0x0FFF. Most programs fit comfortably in a small region near the bottom of memory. The TEC-1G uses the full 64K address space with zones that serve different purposes. Understanding this layout is essential for proper platform configuration. The shadow region at 0x0000–0x07FF is RAM that mirrors ROM when shadow mode is active. Free RAM including monitor workspace occupies 0x0800–0x3FFF while protect-capable user RAM lives at 0x4000–0x7FFF. The expansion window at 0x8000–0xBFFF shows 16K of a 32K banked device. The MON-3 monitor ROM occupies 0xC000–0xFFFF at the top of memory rather than the bottom which is the opposite of the TEC-1 placement.
Programs start at 0x4000 instead of 0x0800. The first time I tried to load a TEC-1 program on the TEC-1G platform it landed in the wrong place. The display showed garbage because the memory map was not a detail I could ignore. The platform configuration reflects this layout precisely with regions defined for ROM zones alongside RAM zones. An appStart of 16384 (0x4000) tells Debug80 where user programs begin while an entry of 0 means the CPU starts at address zero while the shadow mechanism makes that address show ROM contents at boot time. This configuration leads to the three memory modes that make the TEC-1G distinctive. Getting them right was essential for accurate emulation.
Shadow Protect Expand
The TEC-1G has three memory modes controlled by a system control port at 0xFF where each mode serves a distinct purpose in the machine's operation. Grasping these modes is essential for writing programs that work correctly on the hardware. Shadow mirrors the ROM at 0xC000 into the low 2K at 0x0000–0x07FF which is how the machine boots because the CPU fetches from address zero but sees the ROM contents. Shadow mode also exists for compatibility with programs that expect to run from low memory allowing the same code to work on both machines without modification. Protect makes the user RAM region at 0x4000–0x7FFF read-only which serves as a safety rail because when you are typing in a program byte by byte a stray store instruction can erase your work. Protect mode stops that from happening since it is a workflow feature rather than a security feature.
Expand selects which half of the 32K expansion device appears in the 0x8000–0xBFFF window. The TEC-1G expansion socket can hold 32K but only 16K is visible at a time. Toggling the expand bit swaps the visible half to give programs access to more memory than the address space would otherwise allow. The runtime tracks these modes in state variables then enforces them during memory access. The adapter checks shadowEnabled alongside protectEnabled alongside expandEnabled flags on every read operation along with every write operation. When the adapter handles a memory write it checks both the protect flag alongside the address range. A write to 0x5000 succeeds when protect is off but silently fails when protect is on which matches the hardware behaviour exactly.
Booting with Shadow Active
The original implementation started with shadow disabled but that was wrong because the real TEC-1G boots with shadow active so the CPU can fetch the ROM reset vector from address zero. The ROM then initialises the system then optionally disables shadow mode before jumping to user code. I fixed setting by setting shadowEnabled: true at power-on alongside on reset which ensures the emulator behaves the same way as the real hardware from the first instruction fetch. The reset handler also needed updating because when the user resets the machine the emulator must restore shadow mode so the boot sequence works correctly. Failing to do this would cause programs to crash unpredictably after a reset.
MON-3 A Richer Monitor
The TEC-1G ships with MON-3 which is a 16K monitor ROM written by Brian Chiha that represents a significant upgrade from the original MON-1. MON-3 includes a menu system navigated by Plus/Minus plus GO alongside Intel HEX loading over serial alongside block copy alongside backup utilities alongside memory export in multiple formats alongside a built-in disassembler alongside Tiny BASIC alongside real-time clock support alongside graphical LCD library routines. The debug80-tec1g repository packages MON-3 with its source alongside listing files including the binary ROM image alongside the Intel HEX format alongside the assembler listing alongside the original source code alongside included modules for Tiny BASIC plus LCD routines plus disassembly plus the real-time clock plus sound. The extraListings configuration points at mon-3.lst so the debugger can step through monitor code with full source context. When execution enters a ROM routine the source view shows the original assembly instead of raw disassembly.
Platform Repositories
Debug80 itself stays generic because the platform-specific details live in separate repositories that users clone alongside their projects which keeps the core debugger clean while allowing unlimited platform variations. The debug80-tec1 repository contains TEC-1 machine setups including tec1-mon1/ for MON-1 configuration with RAM at 0x0800 plus tec1-mon2/ for MON-2 configuration with RAM at 0x0900 plus sample programs demonstrating serial communication plus matrix keyboard scanning. The debug80-tec1g repository contains TEC-1G machine setups including tec1g-mon1/ for MON-1B compatibility mode plus tec1g-mon3/ for the full MON-3 configuration with RAM at 0x4000 plus sample programs demonstrating LCD control plus other TEC-1G-specific features.
Each machine folder has a .vscode/debug80.json that configures the platform alongside ROM paths alongside extra listings. A developer can open one of these folders in VS Code then immediately start debugging without writing configuration from scratch. The separation means that adding a new machine does not require changes to Debug80 itself. A new TEC-1 variant can live in its own repository with its own ROMs alongside configuration templates while a completely different Z80 system can do the same. The community can share platform configurations without needing to modify the core extension.
The Panel UI
The TEC-1G panel extends the TEC-1 panel with LCD support. It shows the seven-segment display with address registers plus data registers alongside a character LCD that renders the HD44780 display buffer. The panel also displays the current mode indicators for Shadow plus Protect plus Expand so I can see at a glance which memory features are active. The LCD rendering uses the same device model I described in an earlier article. Writes to the LCD command port plus data port update an internal buffer. The panel paints the buffer as a grid of glyphs that update on each cycle. The TEC-1G panel queries buffer on each update cycle then refreshes the display to show exactly what a real LCD would show which makes it easy to develop plus debug LCD-based applications without needing the physical hardware.
What This Enables
I can now debug TEC-1G programs with the same tools I use for TEC-1 programs but without pretending the machines are identical. The memory map resolves correctly so that ROM lives at the right address while protect mode works as expected while shadow mode boots the machine properly. When I step through a MON-3 menu handler the debugger shows the original source. Setting a breakpoint in a ROM routine works correctly because the breakpoint fires even though the code runs in shadowed memory. The platform abstraction handles the address aliasing so I do not have to think about it. The TEC-1G is a more capable machine than the TEC-1 so the debugger now reflects that because it is not a compatibility hack but rather a first-class platform with its own identity plus configuration that respects the hardware's unique characteristics.
Stepping Into ROM: Source-Level Debugging for Monitor Code
By John Hardy
When I step through a TEC-1 program the interesting work often happens at the boundary where my code calls into the monitor ROM then the ROM calls back into my routines. The trouble was that Debug80 only knew about the source files I assembled for the current session. This meant the ROM was a black box since I could see it executing in the disassembly view but I could not see the original source lines. I could not set breakpoints by label either. That gap made it hard to understand what the ROM was doing when my program misbehaved so the fix required two changes to the debugger architecture. The debugger needed a way to load additional listing files that live outside the project. It also needed to build source maps from those listings so that stepping plus breakpoints work the same way they do in user code. The result is a new extraListings configuration option that accepts a list of paths to .lst files. When a debug session starts the adapter loads each listing then parses it then merges the resulting segments into the main source map.
The Extra Listings Configuration
The configuration lives in debug80.json alongside the other platform settings. A typical TEC-1 setup now includes the extra listings array pointing to the ROM listing file. The path resolves relative to the debug80.json base directory though absolute paths also work for users who want to reference listings from a central location. If a listing file is missing the adapter logs a warning to the Debug Console then continues without it. This keeps the session usable even when the ROM source is unavailable. This graceful degradation means that users can share project configurations without requiring everyone to have the same ROM sources installed. The adapter loads each listing at session start then parses the contents line by line building a source map that the debugger uses to correlate addresses with source lines throughout the session.
Building Source Maps from Listings
A listing file contains the assembled output alongside the original source lines. The format varies by assembler but the essential structure is an address column followed by a hex dump of the generated bytes followed by the source text. The adapter parses each line then extracts address ranges for every instruction. Those ranges become segments in the source map where each line with a valid address becomes a segment recording the start address plus the byte count plus the line number. When the CPU hits an address in that range the debugger can now jump to the correct line in the listing file to show the original assembly code alongside the current register state. The parsing logic handles the common listing formats including asm80 plus tasm plus zmac output. The adapter detects the format automatically by examining the first few lines of the file which means users do not need to specify the assembler they used.
Compiling Source Files on the Fly
Listing files work well when they exist but sometimes I only have the original assembly source. I wanted the debugger to handle that case too. If a listing file sits next to a .source.asm file with the same base name the adapter compiles the source using asm80 then builds the mapping from the compiler output. If it sits next to a plain .asm file that also works. The compilation happens at session start when the adapter calls asm80 directly via its JavaScript API using a file resolver hook that lets asm80 resolve include files relative to the source directory. The compile result contains a list of lines with addresses plus byte counts plus a symbol table. The adapter walks both structures then builds segments plus anchors for the source map. This means I can drop a ROM source file next to the listing then the debugger will pick it up automatically. I can set breakpoints by clicking in the source margin while the stack trace shows the original labels instead of raw addresses.
The ROM Source Picker
With multiple ROM sources loaded I needed a way to open them during a session. The debugger now registers a command called debug80.openRomSource that queries the adapter for the list of loaded ROM sources then presents them in a quick pick menu. Selecting an entry opens the file in the editor. The command distinguishes between listing files plus source files. If both exist for the same ROM the picker shows both options so I can choose the listing when I want to see the hex dump. I can choose the source when I want to read the assembly without the noise. The picker also shows the file path plus the address range the source covers. This helps me find the right file quickly when working with multiple ROM modules that each have their own source files.
Shadow Memory Plus Address Aliasing
The TEC-1G adds another layer of complexity because its memory controller can shadow the ROM region at 0x0000–0x07FF with RAM at 0xC000–0xC7FF. With shadow mode active the CPU sees the high RAM contents at the low addresses. This is how the TEC-1G boots since the ROM lives at 0xC000 but the CPU starts execution at 0x0000 because the shadow activates at power-on. The debugger needed to understand this aliasing because when I set a breakpoint at a ROM label the label resolves to an address like 0xC100. With shadow mode active the CPU executes that code at 0x0100 so the breakpoint would never fire because the addresses did not match. I fixed this by teaching the breakpoint checker to consider shadow aliases. When the CPU stops the adapter checks both the raw PC plus its shadow alias against the breakpoint set. The same logic applies to source lookup so if the PC is in the shadowed region the adapter tries the shadow alias when resolving the source file.
This change also required updating the TEC-1G runtime to enable shadow mode at power-on because the previous behaviour started with shadow disabled. This meant the ROM had to explicitly enable it before execution could begin. That was incorrect since the real hardware boots with shadow active so the CPU can fetch from ROM at address zero.
What This Enables
I can now step through the TEC-1 monitor ROM the same way I step through my own code. When my program calls GETKEY I can follow execution into the ROM then watch it scan the keypad. When a subroutine misbehaves I can set a breakpoint inside the ROM then inspect the state when it fires. The source map merging means that the debugger treats ROM code plus user code as a unified address space. The stack trace shows labels from both. The disassembly view annotates ROM addresses with their source lines. The memory panel can jump to ROM symbols. This is the debugging experience I wanted from the start. The ROM is no longer a black box but just another module in the program visible plus inspectable like everything else.
Caching Debug Maps Plus Streamlining the Debugger Workflow
By John Hardy
Every time I launched a debug session the adapter would parse all the listing files then build the debug map from scratch. For a small project that took a fraction of a second but as I added more ROM sources plus extraListings entries the startup time grew noticeable. The fix was straightforward since the listing files rarely change between sessions. If I could detect when the inputs matched their previous state I could skip the parsing then reuse the previous map. The mechanism I chose was content hashing because it handles the case where someone touches a file without modifying its contents.
Content-Hash Based Caching
The caching system computes a SHA-256 hash of every input file at session start then concatenates those hashes in a deterministic order then hashes the concatenation to produce a cache key. If any input file changes the key changes then the cache misses. The adapter stores the serialized debug map alongside the cache key in a JSON file. The location defaults to the VS Code global storage directory so it persists across sessions without polluting the workspace though a configuration option allows overriding the path for users who want the cache in a project-specific location. On subsequent launches the adapter first checks whether the cache file exists then checks whether the stored key matches the computed key. If both conditions hold it deserializes the map then skips parsing entirely. This cuts startup time from seconds to milliseconds for projects with large ROM sources. Any source change automatically invalidates the cache so I never see stale data. The invalidation logic is conservative since even a whitespace change to a listing file triggers a rebuild.
Watching Source Files for Changes
I also wanted the debugger to notice when I edit a source file during a session. The adapter now registers file watchers on all the listing plus source files it loads at session start. When a watcher fires the adapter clears the in-memory map for that file then triggers a rebuild. The rebuild is incremental since the adapter reparses only the affected file while the rest of the map remains intact which keeps the disruption minimal. The debugger continues running during the rebuild so I do not lose my place. This matters most when I am iterating on a bug in the ROM source because I can edit the listing file then save it then immediately see the updated source lines in the editor without restarting the session.
Auto-Opening Source Files
A small but persistent annoyance was that starting a debug session required manually opening the source file before I could set breakpoints. I added an option called openSourcesOnSessionStart that takes a list of file patterns. When a session starts the adapter expands those patterns against the source map then opens matching files in the editor. The typical configuration opens the main program file plus any ROM sources I frequently debug. The files open in the background so they are ready when I need them but do not steal focus from the active editor. The patterns support globs so I can specify *.asm to open everything. I can specify /mon-3/ to open only the MON-3 sources. The pattern matching uses the same library the rest of the codebase uses for path resolution which keeps behaviour consistent.
Consolidating the Memory Panel
The memory panel started as two separate webviews because the TEC-1 plus TEC-1G platforms had different memory layouts. I wanted each to show only the relevant regions but maintaining two implementations doubled the work whenever I changed the panel styling. Adding a feature meant doing the work twice. I merged them into a single panel that queries the adapter for the platform's memory map at session start. The unified panel renders a list of regions where each region gets a collapsible section with a hex dump. The section header shows the region name alongside its address range which makes it easy to scan for the region I want. The adapter provides the memory map within the platform configuration so adding a new platform with a different layout does not require changing the panel code since the panel just iterates the regions it receives.
What This Enables
The caching change makes launching a session feel instant. This matters because I often stop then restart sessions when I am exploring a bug then want to reset the CPU state. Waiting for the map to rebuild was interrupting my flow. The auto-open feature means the source is ready when I need it so I can set a breakpoint in the first few seconds without hunting for the file. The consolidated memory panel reduces maintenance burden while giving me a clearer view of the address space. These are small quality-of-life improvements but they compound over a long debugging session. The debugger now feels polished rather than rough like a tool I enjoy using rather than one I tolerate.
The original Debug80 panel was a standard webview that opened in an editor column. While that worked fine for focused debugging it fought for space whenever I needed to see both the source code plus the panel simultaneously. I would end up resizing constantly dragging the split bar back then forth as my attention shifted. The panel would steal focus when I did not want it to so the editor lost keyboard input until I clicked back. The sidebar seemed like a better home because it sits to the side of the editor by default while staying visible without demanding attention while using the familiar activity bar icon pattern that VS Code users already understand. I set out to migrate the panel from a plain webview to a WebviewView.
The WebviewView Migration
A WebviewView is a webview that lives in the sidebar rather than an editor column though it can also live in the bottom panel. VS Code registers them through a viewContainer contribution in the extension manifest so the first step was declaring a new activity bar container with an icon then contributing a view inside that container. The view contribution specifies a factory function that creates the webview contents. The factory receives a WebviewView instance alongside a context object so I moved the existing rendering logic into that factory. The HTML plus JavaScript remained almost unchanged since the webview API is the same whether the webview lives in an editor column or the sidebar. I had to adjust the CSS layout because the sidebar width is narrower plus fixed so I switched from a multi-column layout to a single scrollable column.
Activity Bar Integration
The activity bar icon gives users a persistent way to show or hide the panel. Clicking the icon reveals the sidebar with the Debug80 view selected which is the standard pattern for tools like the file explorer plus source control. I chose a simple debug-themed icon that matches the VS Code aesthetic. The icon supports a badge that shows a count so I wired it up to display the number of active breakpoints. This gives me a quick glance at the debugging state without opening the panel. The badge updates whenever breakpoints change through the webview messaging channel so the extension host does not need to poll which keeps the UI responsive even when the debugger sits paused at a breakpoint.
Session-Aware Routing
With the panel in the sidebar I wanted it to automatically track the active debug session. If I have multiple sessions running simultaneously the panel shows the one I am currently interacting with. The extension listens for debug session changes then posts a message to the webview when the active session changes. The webview then requests state from the new session then updates its display. The routing also handles session termination gracefully since when a session ends the panel clears its display then shows a placeholder message inviting me to start a new session. This prevents the panel from showing stale data that might confuse me if I forgot which session I was looking at.
Preserving State Across Sessions
A side effect of the sidebar placement is that the webview can persist across debug sessions which was not possible with the editor-column approach because closing the session closed the editor so the view state would reset every time. The sidebar view stays open so I added state serialization so the view remembers its scroll position alongside the collapse state of each section alongside any search or filter text. When I start a new session the view picks up where I left off. The serialization uses the webview state API rather than the extension's global state which scopes the data to the view instance plus avoids polluting the global namespace so each workspace can have its own view preferences.
What This Enables
The sidebar placement integrates the panel seamlessly with VS Code rather than presenting an add-on that demands attention. I can keep it visible while editing code without the constant resizing dance. The activity bar icon provides a quick toggle when I do not need the panel. The badge keeps me informed without requiring me to open anything so I know at a glance how many breakpoints I have set. The session-aware routing means I do not have to think about which session the panel is showing because it follows my focus automatically. The preserved state means I can pick up where I left off even after restarting VS Code. These changes give the debugger an integrated appearance rather than a bolted-on afterthought. I find myself leaving the panel visible all the time now because it no longer obstructs my workflow.
The TEC-1G uses an HD44780-compatible LCD display that shows sixteen characters on each of its two rows. When I started the Debug80 project I implemented only enough of the controller to get text on the screen. That meant writing characters to DDRAM plus reading the busy flag. The display would show characters where the program wrote them but cursor movement was wrong while shifting did not work while custom characters were missing entirely. The incomplete simulation meant I could not debug LCD-related code effectively because the display behaved differently from the real hardware. I set out to fill in the gaps then make the simulation accurate enough to trust.
Entry Mode Plus Cursor Movement
The entry mode register controls what happens after each character write. The HD44780 supports two behaviours depending on the increment/decrement bit plus the shift flag. After writing a character the address counter either increments or decrements. The display optionally shifts in the opposite direction. The implementation stores the entry mode bits then applies them after each DDRAM write. If the mode is increment with shift then writing a character advances the cursor then shifts the entire display left. This creates a scrolling effect where new text pushes old text off the screen. The challenge came in handling the wrapping since the address counter wraps from the end of DDRAM back to the beginning. The display shift is cyclic so characters that shift off one side appear on the other. Getting those details right required reading the datasheet multiple times then comparing the simulation output to captured traces from real hardware.
Display Control Plus Blink
The display control register determines whether the display is on or off while also determining whether the cursor is visible while also determining whether the cursor blinks. I implemented all three flags so the simulation matches the visual appearance of a real LCD. The cursor appears as an underline when visible. When the user enables blinking it alternates between visible plus invisible on a timer. The blink rate matches the datasheet specification because programs sometimes rely on the timing for visual feedback. The display-off state is distinct from clearing the display since the contents remain in DDRAM then reappear when the display turns back on. I had to track the display state separately from the memory contents. The panel rendering queries that state before drawing so it can show a blank screen when the display is off.
Shift Commands
The shift commands move either the cursor or the entire display without affecting DDRAM contents. The HD44780 uses the same command byte for both operations with a single bit distinguishing them. Cursor left shifts the address counter down while display left shifts all the characters one position to the left. The shift amount is always one position since programs build larger shifts by issuing the command multiple times so the simulation just applies the shift each time it sees the command without trying to batch them. The display shift maintains the relationship between DDRAM addresses plus display positions. If I shift the display right the character that was at the left edge wraps to the right edge. The address counter still points to the same DDRAM location even though the visible content has moved.
Custom Character RAM
The CGRAM feature lets programs define custom characters by writing pixel patterns to a dedicated memory region. Each custom character occupies eight bytes corresponding to the eight rows of pixels. Each byte holds five bits for the five columns. The HD44780 supports eight custom characters stored at CGRAM addresses zero through seven. Programs display them by writing character codes zero through seven to DDRAM so the simulation intercepts those codes then renders the custom pattern instead of looking up a font glyph. The panel drawing code reads the CGRAM contents then builds a pixel grid for each custom character. The grid uses the same scaling as the built-in font so custom characters blend in visually. This makes the simulation useful for programs that define custom icons or graphics.
What This Enables
The completed LCD simulation means I can debug TEC-1G programs that use the display without worrying that the simulation will diverge from the hardware since scrolling text appears correctly while custom characters appear correctly while blink effects appear correctly. When a program fails to initialise the display properly the simulation shows the same wrong output the real hardware would show. This helps me identify initialisation bugs rather than blaming the simulation. The accuracy also builds confidence in the platform runtime because if the LCD simulation matches the rest of the peripheral simulation is more likely to be correct. That confidence lets me focus on my program instead of second-guessing the debugger.
The TEC-1G breaks from the TEC-1 tradition of partial address decoding. The original TEC-1 decoded only the low three bits of the port address so that port 0x00 plus port 0x08 addressed the same hardware. The TEC-1G uses full eight-bit decoding with each port having a unique address that does not mirror anywhere else in the I/O space. The Debug80 simulation inherited the TEC-1's partial decoding because I started the TEC-1G runtime by copying the TEC-1 code then modifying it. Ports were mirroring incorrectly so programs that relied on the full decoding would see wrong behaviour when they accessed ports at addresses the simulation did not recognise.
Full Port Address Decoding
The fix required reviewing every port access in the simulation then changing the address comparisons from masked checks to exact matches. Where the code previously tested (port & 0x07) === 0x01 to detect the seven-segment display port it now tests port === 0x01 for the TEC-1G. It keeps the masked check only for the TEC-1 runtime. The change cascaded through the I/O handlers because each handler needed to know which runtime it belonged to. I extracted the port constants into platform-specific configuration objects so the handlers could reference config.SEGMENT_PORT rather than hardcoding the number. The configuration approach also made it easier to add new ports later since I just add an entry to the configuration object then write a handler rather than scattering magic numbers through the code.
The SYS_CTRL Register
The TEC-1G adds a system control register at port 0xFD that programs use to configure the memory mode alongside the serial port speed alongside other system-wide settings. Writing to this register changes the hardware behaviour immediately so the simulation needed to intercept writes then update its internal state. The memory mode bits control the shadow plus protect plus expand features I described in the first article. Writing a value with the shadow bit set enables shadowing. The simulation checks that bit when resolving memory reads plus writes. The register is write-only on the real hardware. Reading it returns undefined values so the simulation returns zero for compatibility with programs that accidentally read the port.
The SYS_INPUT Register
The system input register at port 0xFE provides read-only status information including the speaker feedback line plus the serial input state plus the memory configuration switches. The simulation exposes these values so programs can query the hardware state. The memory configuration switches determine the power-on memory mode. The simulation reads them from the platform configuration so I can test programs that expect different switch settings without modifying the runtime code. The speaker feedback line reflects the last value written to the speaker output which programs use for software timing loops. The serial input comes from the terminal emulation so when I type in the terminal panel the bits appear in this register.
Expansion Port Banking
The TEC-1G's expansion port includes a banking register that selects which region of a large external memory appears in the expansion window at addresses 0x8000 to 0xBFFF. Programs write a bank number to this register to page in different sections of an attached memory board. The simulation models this with a bank index that multiplies by the window size when translating addresses. Reading from 0x8000 with bank three selected actually reads from offset 0xC000 in the expansion memory array. The bank switches instantly when the register is written without any delay or interleaving. The expansion memory itself is a configurable array that defaults to sixteen kilobytes. I can override the size in the platform configuration to simulate larger or smaller expansion boards. If a program accesses an address outside the configured memory the simulation returns 0xFF which matches the behaviour of an empty bus.
What This Enables
The corrected port decoding means programs run correctly on the simulation even when they assume full eight-bit addressing. This includes most TEC-1G software since authors know the hardware has exact decoding. The SYSCTRL plus SYSINPUT registers let me debug programs that change memory modes at runtime. I can watch the transition from shadow mode to normal mode then verify that the addresses resolve correctly before plus after. The expansion banking support opens the door to testing programs that use external memory. While I do not have a physical expansion board to verify against the simulation follows the documented behaviour so it should work when the hardware arrives.
By John Hardy, recording Debug80 project notes plus a build log.
The Debug80 extension uses VS Code webview panels to display hardware state. The TEC-1 panel shows seven-segment displays alongside the keypad with speaker activity. The TEC-1G panel adds an LCD character display with status LEDs. Both panels need JavaScript to handle message passing between the webview and the extension host. That JavaScript had accumulated inside TypeScript files as template literal strings, and it was making the codebase harder to maintain.
I counted the damage: 1453 lines in ui-panel-html-script.ts for TEC-1 plus 1413 lines in the corresponding TEC-1G file. Both files consisted almost entirely of a single exported function that returned a massive string containing mingled HTML with CSS with JavaScript. The pattern looked like this in every file:
export function getPanelScript(): string {
  return `
    <script>
      const vscode = acquireVsCodeApi();
      // ... 1,400 more lines
    </script>
  `;
}
The problems with this approach were immediate: the editor provided no syntax highlighting or type checking for the embedded code, and autocompletion and breakpoints both failed. Every edit required careful attention to quote escaping and string interpolation boundaries. Refactoring tools could not see inside the strings. The files were technically TypeScript, but the interesting code was invisible to the toolchain.
The extraction plan
I created a webview/ directory at the project root. For each platform, there is a dedicated subdirectory: webview/tec1/ and webview/tec1g/. Inside each platform folder, the structure is clear. The index.html file defines the layout and structure. The styles.css file handles presentation and visual details. The index.ts file manages behaviour and interactivity. To avoid duplication, a shared webview/common/styles.css holds styles used by both panels. This separation makes it easier to maintain and update each layer of the webview independently.
The HTML files use placeholder tokens that the extension replaces at runtime. Each file serves a distinct role in the rendering pipeline. One defines structure while another controls presentation; the third handles interactivity. This division of responsibilities makes the codebase easier to navigate and reason about. Instead of treating the webview as a single concern, the new approach gives each layer its own file and clear role. This makes the codebase more maintainable and easier to understand. The structure is now clear, and each file stands on its own. Every section of the webview is now clearly defined and easy to locate.
The extension loads the template then substitutes the tokens with webview-safe URIs before serving the result. The TypeScript files compile to JavaScript through esbuild. The CSS files copy unchanged to the output directory.
Setting up the build
I added a build script at scripts/build-webview.js that handles both platforms:
The outbase option preserves the directory structure so that webview/tec1/index.ts becomes out/webview/tec1/index.js. Static files (HTML and CSS) copy to matching locations. The extension resolver checks for compiled output first and falls back to source files during development.
The HTML builder changes
The old getTec1Html function generated everything inline. The new version reads a template file and performs token substitution:
The function resolves paths for both compiled and source directories so that the extension works during development without a build step. When the out/webview/ directory exists, it serves compiled assets. Otherwise, it falls back to the source webview/ directory. This fallback behaviour makes iterating on webview code faster because I can edit the TypeScript directly and reload the panel without running the build.
What I gained
The webview TypeScript now has proper syntax highlighting and type checking. VS Code shows errors in the problems panel. Code completion and navigation to definitions both work properly. The separation of concerns is cleaner and more explicit. HTML structure lives in HTML files, while styles live in CSS files. Behaviour lives in TypeScript files and ties the layers together. This clear separation improves maintainability and helps new contributors understand the project faster. Each section of the webview is now easier to update and debug. The responsibilities are now distributed rather than blurred, which makes the codebase easier to maintain and less error-prone.
The total line count dropped from 2,866 to around 1,800 across the new files. This reduction happened partly because I removed duplicate code between the two platforms. Proper formatting without string escaping also takes fewer lines. The remaining code is easier to read and maintain. The codebase is now more approachable for future changes.
The build adds a step to the release process, but the tradeoff is worthwhile. Development-time feedback catches errors that previously hid inside opaque strings. The webview code is now a proper citizen of the TypeScript ecosystem, no longer an awkward guest.
Lessons from the extraction
I should have structured the webview code this way from the start. The JavaScript-in-strings pattern emerged because I wanted to keep everything in one file during early prototyping. That convenience became a liability as the panels grew more complex. The refactoring cost was modest—a few hours of work—but it would have been cheaper to establish the pattern before the code reached 2,866 lines. This experience taught me the value of clear structure and early investment in maintainability.
The extraction pattern applies to any VS Code extension with non-trivial webview content. Template files with token substitution work alongside a TypeScript bundler and a resolver that handles both development and production paths. The structure scales to multiple webviews without duplicating the infrastructure code.
The Z80 has a baroque instruction encoding that requires careful handling. A single-byte opcode might decode to one instruction, or it might be a prefix indicating that the real opcode follows. The CB prefix introduces bit manipulation instructions. The DD and FD prefixes switch the operand register from HL to IX or IY. The ED prefix accesses extended instructions like block moves and I/O loops. Combinations like DD CB introduce indexed bit operations with yet another encoding scheme. Every path through this maze needs code to handle it.
The Debug80 decoder started as a single file with nested switch statements. I added cases as I encountered instructions during testing. By the time I had reasonable Z80 coverage, the file had reached 1,616 lines. The primary opcode switch alone spanned hundreds of lines. The prefix handlers added hundreds more lines of their own. The file had become difficult to navigate and slower to load than I liked.
The split
I reorganised the decoder into separate modules by prefix:
- decode-primary.ts handles unprefixed opcodes (the main instruction set) - decode-cb.ts handles CB-prefixed bit operations - decode-dd.ts handles DD-prefixed IX instructions - decode-fd.ts handles FD-prefixed IY instructions - decode-ed.ts handles ED-prefixed extended instructions - decode-ddcb.ts handles the indexed bit operations (DD CB and FD CB) - decode-helpers.ts contains shared utilities for operand formatting
Each module exports a single decoder function that takes the instruction bytes and returns a decoded result. The main decoder dispatches to the appropriate module based on the first byte. The structure mirrors the CPU's own decoding logic: check the prefix, then delegate.
The split made each module independently testable. I could verify CB instructions without loading the entire decoder. The file sizes dropped to a few hundred lines each, small enough to hold in working memory while editing. The organisation also made gaps visible in the implementation. When I noticed that decode-ed.ts was missing block I/O instructions, the absence stood out.
The caching problem
A debugger decodes instructions constantly. Single-stepping through code means decoding the current instruction, then the next, then the next. Memory views decode ranges of bytes to show disassembly. Breakpoint displays decode the instruction at each breakpoint address. The same instructions decode repeatedly during a debugging session.
The Z80's instruction encoding is deterministic: the byte sequence 21 00 40 always decodes to LD HL, 4000h regardless of context. No mode switching changes the interpretation of bytes. No hidden state affects the decoding process. Once decoded, an instruction's representation remains constant forever. This determinism makes caching straightforward to implement.
WeakMap as a cache
JavaScript's WeakMap provides a natural caching mechanism for object keys. I treat each instruction's byte sequence as a Uint8Array and use that array as the cache key. When decoding, the decoder first checks whether the byte sequence exists in the cache. If so, it returns the cached result immediately. If not, it decodes the instruction then stores the result then returns it.
const cache = new WeakMap<Uint8Array, DecodedInstruction>();

function decode(bytes: Uint8Array): DecodedInstruction {
  let result = cache.get(bytes);
  if (result) {
    return result;
  }
  result = decodeInstruction(bytes);
  cache.set(bytes, result);
  return result;
}
The WeakMap holds references weakly so entries can be garbage-collected. When the byte array goes out of scope elsewhere, the cache entry becomes eligible for garbage collection. This prevents the cache from growing without bound during long debugging sessions. The cache stays proportional to the working set of instructions currently relevant rather than accumulating every instruction ever seen.
Cache hit rates
I instrumented the decoder during typical debugging sessions to measure cache effectiveness. The hit rate depends on the program under test, but typical values exceed 95 percent. A tight loop like a delay routine might decode the same handful of instructions thousands of times. The decoder does the work once and serves the cached result for subsequent hits.
The miss rate spikes when scrolling through memory views because each scroll brings new addresses into view. Even then, returning to previously viewed regions hits the cache. The steady-state behaviour favours the cache heavily.
Performance characteristics
The cache lookup is fast—a hash table probe and a reference comparison. The cache miss path runs the full decoder, which involves a switch dispatch and operand parsing. For multi-byte instructions with displacement values or immediate values, the parsing includes bounds checking alongside endianness conversion. The cached path skips all of that.
The memory overhead is proportional to the number of unique instructions in the cache. Each entry holds a Uint8Array key (typically 1 to 4 bytes) and a decoded result object (a few tens of bytes including the mnemonic string and operand descriptions). For a program with a few hundred unique instruction patterns, the cache consumes a few kilobytes. The memory cost is negligible compared to the time saved.
Lessons from the refactor
Breaking the decoder into modules forced me to think about the instruction set systematically. The Z80's prefixing scheme, awkward as it sometimes feels, maps naturally onto a module-per-prefix structure. The code now reflects the architecture it decodes.
The caching emerged from profiling the decoder during real sessions. I noticed redundant decoding in the hot path and asked whether the work was necessary. The deterministic encoding made the answer obvious while the WeakMap made the implementation clean while the hit rate validated the approach.
The two changes—splitting and caching—happened in the same commit because they reinforced each other. The split made the decoder easier to reason about while the caching made it faster. Together, they transformed a sprawling file into a maintainable subsystem with measurable performance characteristics.
First Read, Wrong Data: Emulating the ST7920's Pipeline
Written by John Hardy on February 7th, 2026
The TEC-1G includes support for the ST7920 graphical LCD controller, a chip that drives 128×64 pixel displays using a parallel interface. Programs can write pixels to display buffer memory and read them back for verification or manipulation. The read path has a quirk that tripped me up: the first read after setting an address returns the data from the previous address, not the address you just specified.
I discovered this while testing a graphics routine that drew shapes and then verified the framebuffer contents. The routine worked correctly on real hardware but failed in my emulator. The verification loop expected specific pixel patterns and found zeros instead. The writes were landing correctly (I could see the display updating) but the reads returned wrong values.
The pipeline behaviour
The ST7920's data sheet explains the read pipeline in a few terse sentences. When you set the address counter with a command, the controller latches the new address but does not immediately fetch the corresponding data. The data bus still holds the previously fetched value. To read the data at the new address, you must perform a dummy read that primes the pipeline, then perform the actual read that returns the wanted value.
The correct read sequence proceeds through four steps. First, write a command to set the address counter to address N. Second, perform a dummy read and discard the result. Third, perform the real read which returns data at address N. Fourth, subsequent reads return data at incrementing addresses starting from N+1 as the address auto-increments.
The dummy read triggers an internal fetch from address N. That fetch completes during the read cycle, and the data becomes available for the next read. If you skip the dummy read, you get stale data from whatever address was previously active.
Why emulators get this wrong
A naive emulator models the data read as a simple array lookup: given address N, return memory[N]. This works for writes, which take effect immediately, but fails for reads because it ignores the pipeline delay. The real chip does not deliver data from address N until one read cycle after you request it.
My initial implementation did exactly this: the read handler received the address and returned the corresponding byte from the display buffer. Writes worked as I expected them to work. Single reads without address changes also worked correctly. Yet any code that set an address then immediately read from it returned the wrong value.
The fix required modelling the pipeline state. The emulator now tracks two values: the current address counter and the pending read value. When code sets a new address, the pending value stays stale. The first read returns the pending value and then loads the new address into the pipeline. Subsequent reads continue through the buffer with automatic incrementing.
The implementation
The TEC-1G runtime maintains a glcdPendingRead field alongside the display buffer. When the address counter changes, this field is not updated. When a read occurs, the emulator returns glcdPendingRead and then fetches the byte at the current address into glcdPendingRead for the next read. The address counter increments after the fetch.
readGlcdData(): number {
  const value = this.glcdPendingRead;
  this.glcdPendingRead = this.glcdBuffer[this.glcdAddress];
  this.glcdAddress = (this.glcdAddress + 1) & 0x1FFF;
  return value;
}
Setting a new address resets the pipeline state to a known value. I chose zero, which matches what I observed on hardware when reading from an uninitialised region.
The dummy read that programs must perform consumes the zero then primes the pipeline with the actual data at the new address. Subsequent reads then return correct values from the buffer.
Testing the fix
I wrote a test that exercises the pipeline behaviour explicitly:
it('returns stale data on first read after address change', () => {
  runtime.writeGlcdData(0xAA);  // Write 0xAA at address 0
  runtime.setGlcdAddress(0);    // Reset address to 0
  const dummy = runtime.readGlcdData();  // Dummy read
  const actual = runtime.readGlcdData(); // Real read
  expect(dummy).toBe(0x00);     // Stale/reset value
  expect(actual).toBe(0xAA);    // Actual data
});
The test captures the exact behaviour that the original routine depended on. With the pipeline modelled correctly, the verification loop in the graphics routine passes.
Hardware verification
I confirmed the behaviour on a physical TEC-1G with an ST7920 display attached. A short Z80 program writes a known pattern to display memory then sets the address then performs reads then reports the values through the serial port. The first read after setting the address returned zero. The second read returned the written value. The emulator now matches the hardware behaviour.
The data sheet describes this behaviour, but the description is easy to overlook. The phrase "dummy read" appears once without much context. I had read the data sheet before and missed the implication. Seeing the actual hardware behaviour made the documentation make sense retroactively.
Implications for emulator design
Peripheral emulation often requires modelling internal timing and sequencing, not just the logical contents of registers. The ST7920's read pipeline is invisible to code that only writes to the display—writes take effect immediately—but becomes critical for code that reads back. An emulator that supports only writes might pass basic tests and fail on more sophisticated programs.
The fix was small, just a few lines of state management. Finding the bug took longer because the symptoms (reads returning zero) could have indicated many different problems. Once I understood the real chip's behaviour, the solution was obvious. The lesson is familiar: when emulation diverges from hardware, the data sheet usually contains the answer, even if it takes a second reading to find it.